Understanding your ad performance metrics isn’t just about checking numbers. It’s about knowing what those numbers mean and how they connect to your campaign’s profitability. In the fast-changing world of digital marketing, the ability to interpret ad metrics can mean the difference between wasted ad spend and scalable growth.
1. Start with the Metrics That Matter
Every platform provides dozens of analytics, but not all of them are equally valuable.
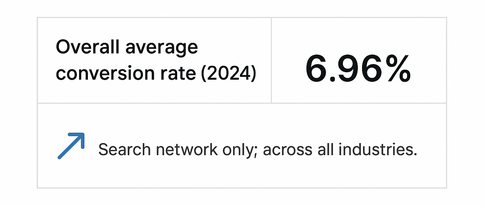
Benchmark: 2024 average conversion rate across industries in Google Ads = 6.96%
Focus on key performance indicators (KPIs) that align with your business goals. For most campaigns, the essential metrics include:
-
CTR (Click-Through Rate): Indicates how engaging your ad is. A CTR above 2% is considered strong for most industries.
-
CPC (Cost Per Click): Shows how efficiently you’re buying attention. Lower CPC isn’t always better if your conversions are weak.
-
Conversion Rate: Measures how many people take the desired action after clicking your ad. The average conversion rate across industries is about 3.75% according to industry benchmarks.
-
ROAS (Return on Ad Spend): The ultimate metric. A ROAS of 400% means you earn $4 for every $1 spent on ads.
2. Segment and Compare for Context
Looking at overall averages can hide insights. Always segment your data by:
-
Audience type (age, interests, or location)
-
Device (mobile vs desktop)
-
Ad placement (feed, stories, search results)
For example, a campaign may have a 5% CTR overall, but when you segment by audience, you might find that one group performs at 8% while another lags behind at 2%. That’s where you find optimization opportunities.
3. Measure Engagement Beyond Clicks
Clicks are only the beginning. Deeper engagement metrics tell you whether your ad truly connects with the audience. Track:
-
Average watch time (for video ads)
-
Engagement rate (likes, comments, shares)
-
Landing page bounce rate (how many visitors leave without interacting)
According to a 2024 internal study across LeadEnforce users, campaigns that optimized their landing pages for speed and relevance saw a 28% decrease in bounce rate and 41% higher conversion rates.
4. Track Funnel Performance
Your ads are just the entry point. To analyze metrics like a pro, you need to view results across your entire sales funnel — from awareness to purchase.
If your CTR is strong but conversions are weak, the issue likely lies in the landing page or offer. On the other hand, if impressions are low, you may need to adjust audience targeting or ad frequency.
5. Automate Insights with Tools
Manually collecting and comparing all these metrics can take hours. Platforms like LeadEnforce make it easy by automatically tracking your campaign performance across channels, identifying your best-performing audiences, and suggesting budget adjustments in real time.
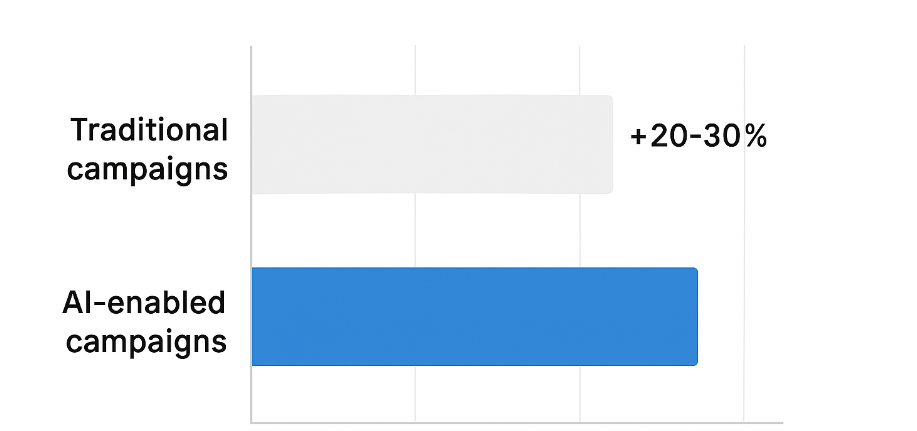
AI-enabled campaigns demonstrate 20-30% higher ROI than traditional campaigns
By using AI-powered audience targeting and analytics, marketers report up to 35% improved ROAS after refining their campaigns through LeadEnforce.
6. Turn Data into Strategy
Numbers mean nothing without action. Once you identify trends, take immediate steps:
-
Pause underperforming ads
-
Reallocate budget to top audiences
-
A/B test new creatives and landing pages
-
Use lookalike audiences based on best converters
Consistent analysis and quick adjustments are what separate average marketers from professionals.
Related Articles You Might Enjoy
Final Thoughts
Analyzing ad metrics like a pro is less about complicated math and more about critical thinking. Once you understand the story behind your numbers, every campaign becomes a learning opportunity — and every click brings you closer to predictable success.