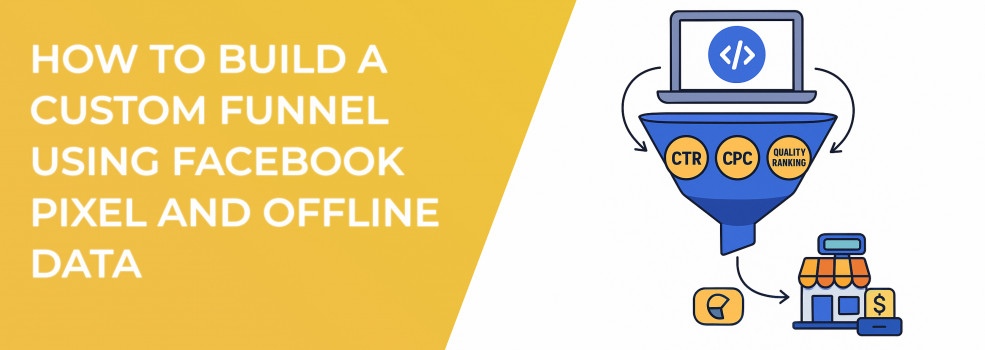
If you have spent late nights staring at Facebook ad performance reports and sensed that the numbers are incomplete, you are not imagining things. Standard dashboards track clicks, impressions, and cost-per-click, but they cannot tell you whether those digital interactions become real-world revenue. By combining Facebook Pixel events with offline conversion data, you uncover the full customer journey from first impression to cash in the register and unlock a fresh level of Facebook ad optimization. The guide below walks through every step in that process and explains why each one matters.
1. Why a Custom Funnel Outperforms “Set and Forget” Campaigns
Most advertisers rely on the linear funnel Facebook suggests: Awareness, Consideration, Conversion. That template works for basic online stores, yet it ignores high-value actions that happen away from the screen — product demos on the showroom floor, phone orders taken by sales reps, and paper sign-ups collected at trade shows. A custom funnel gives every touchpoint a clear place so you stop guessing and start managing intent.
Before we dive into the how-to steps, review the table below. It illustrates how offline data fills major blind spots in a traditional setup.
After seeing the alignment side by side, you can appreciate how metrics such as average click-through rate (CTR) and cost per click (CPC) gain new meaning. They become early indicators you can act on rather than isolated numbers in a vacuum.
2. Lay the Digital Foundation: Create and Configure Your Facebook Pixel
Your custom funnel lives or dies on clean digital data. In the steps below you will create a new Pixel and make sure it captures high-intent events instead of just superficial traffic.
-
In Events Manager, select Connect Data Sources, choose Web, and click Facebook Pixel.
-
Name the Pixel, accept the default settings, and copy the code snippet.
-
Paste the code in the
<head>section of every page, or use a one-click integration in Shopify, WordPress, or Google Tag Manager if you prefer no-code options. -
Add at least five meaningful events:
PageView,ViewContent,AddToCart,InitiateCheckout, andPurchase.
Completing those four actions ensures that Facebook’s algorithm sees not only visits but also signals that buyers are moving deeper into your funnel. After you finish, open an incognito window, browse key pages, and confirm that each event fires in the Meta Pixel Helper. This small test prevents days of skewed reporting later.
3. Track the Numbers That Drive Revenue
With your Pixel operating correctly, it is time to monitor the metrics that predict profit instead of vanity success. The bullets below outline the three most reliable indicators and explain why each is valuable.
-
Average click-through rate (CTR). Successful accounts tend to range between 0.9% and 1.5%. When CTR rises within that band, creative is resonating with the audience.
-
Average cost per click (CPC). A climbing CPC without a proportional CTR increase often signals ad fatigue or narrowing audience pools.
-
Quality ranking and engagement rate ranking. High scores here push CPM down and let you win better placements in the auction.
These metrics reveal campaign health at a glance.
Once you document these KPIs, translate them into a quick narrative for your team: for example, “CTR improved last week after we changed the headline, but CPC crept up because frequency doubled. Our next test will refresh creative to protect CPM.” Turning numbers into a story makes it easier for stakeholders to approve the next move.
When clicks are plenty but sales stall, this guide to Facebook ads not converting will help pinpoint the bottleneck.
4. Collect and Prepare Offline Data
Pixel data cannot see everything that happens after a prospect clicks away from your site. To solve that gap, collect first-party records — names, emails, phone numbers, purchase amounts, and order dates — and format them so Facebook’s offline conversion system can read them. The checklist below shows the exact steps.
-
Format the file with Facebook’s Offline Conversions template in CSV or JSON. The template includes mandatory headers that must match.
-
Hash sensitive fields such as email addresses before upload. Facebook will hash on its own if you skip this step, but hashing earlier adds an extra layer of security.
-
Timestamp every event in local store time rather than server time. Accurate timestamps ensure attribution windows line up with ad delivery windows.
Taking those three precautions boosts your match rate, which directly affects how many offline sales appear in Ads Manager. The higher the match rate, the more clearly you see the true return on ad spend (ROAS).
5. Sync Offline Events With Facebook
Now that the data is clean, bring it into Facebook so the platform can tie real-world sales to ad impressions. Follow the numbered process below to complete your first upload and verify the connection.
-
In Events Manager, open Offline Events and click Create Set.
-
Map every column in your file to the matching Facebook field, then upload.
-
After processing, check your match rate. Aim for at least 90%.
When you finish, take a moment to compare online and offline conversions inside Ads Manager. You will often discover that a campaign driving modest online sales is responsible for significant in-store revenue. That finding lets you shift campaign budget optimization toward audiences that move cash registers rather than simply producing clicks.
6. Build Custom and Lookalike Audiences
With two data streams — Pixel and offline — flowing into your account, you can create audiences that target proven buyers or close lookalikes. The examples below offer three high-value segments.
-
A custom audience of users who added items to cart but did not purchase within the last seven days.
-
A custom audience of leads who attended a webinar or live event yet have not booked a sales call.
-
A lookalike audience based on the top 10% of offline spenders from the previous 90 days.
Leverage both custom and lookalike audiences to scale proven buyers.
Need help deciding which segment to scale first? This comparison of custom versus lookalike audiences will clarify when each one drives the best ROAS.
Building these segments allows Facebook’s machine learning to search for people who behave like your existing customers instead of random prospects. Expect CPMs to decline and conversion rates to rise because you are giving the algorithm better seed data.
7. Optimize With Campaign Budget Optimization
With smart audiences in place, turn on campaign budget optimization so Facebook can shift spend toward ad sets that deliver the best cost per result. If you still see the “Learning Limited” label, apply the fixes below.
-
Combine overlapping ad sets until you achieve roughly 50 conversions per week.
-
Increase daily budget to at least 50 times your target cost per result so the system has room to gather data.
-
Expand the conversion window from seven-day click and one-day view to seven-day click and seven-day view.
These changes give the algorithm enough volume to exit the learning phase quickly. Once that happens, cost per acquisition often drops because Facebook has a clear signal on who converts online and offline.
8. Retarget and Refresh Creative
A high-performing funnel never stands still. Regular maintenance prevents fatigue and keeps costs stable. This tutorial on spotting and curing ad fatigue shows exactly how to refresh creatives before performance dips.
Rotating creatives keeps frequency in check and engagement high.
Use the recurring tasks below as a weekly playbook.
-
Retarget cart abandoners within 24 hours using urgency-based offers such as limited-time discounts.
-
Refresh ads every seven to ten days if frequency climbs above three.
-
Run ads analysis reports each week to spot placement overlap or rising CPM in specific audience segments.
Consistent iteration maintains a strong CTR and healthy CPC, safeguarding your overall Facebook ad performance while you scale spend.
9. Troubleshoot Common Roadblocks
Even with careful setup, issues can surface. Keep this reference list handy to diagnose problems fast.
-
High impressions but low clicks. Audit headlines, imagery, and calls to action, then split-test new hooks.
If Facebook warns that an ad set may get zero impressions, here’s what it means and how to resolve it. -
Cost per 1,000 impressions rising. Broaden your audience or enable auto-placements so Facebook can hunt for cheaper inventory.
-
Persistent Learning Limited label. Consolidate smaller ad sets or switch optimization to a higher-volume event such as
AddToCart.
Solving these hiccups early protects both budget and momentum, ensuring the funnel keeps producing reliable revenue data.
10. Measure What Matters
With a holistic funnel running, shift your reporting focus from micro metrics to business outcomes. The three points below outline the most revealing KPIs.
-
Revenue per lead confirms that targeting and creative resonate with profitable segments.
-
Online versus offline ROAS highlights hidden profit pockets the Pixel alone would miss.
-
Customer lifetime value signals when it is safe to bid more aggressively on acquisition campaigns.
Tracking these advanced indicators gives leadership the confidence to reinvest in campaigns because they see a direct line from spend to revenue, not just clicks to landing pages.
Final Thoughts
Combining Facebook Pixel events with offline conversion data transforms partial attribution into full-funnel clarity. As you refine creative, targeting, budgets, and match rates, your Facebook ad optimization efforts compound and your cost-to-revenue ratio improves. Follow the steps outlined above, and watch a scattered data trail evolve into a predictable, scalable growth engine for your business.

