Instagram remains one of the strongest platforms for ecommerce brands due to its highly visual format and built‑in shopping behavior. According to industry benchmarks, nearly 70 percent of shoppers turn to Instagram for product discovery, and more than 40 percent of users say they’ve purchased a product after seeing it on the platform.
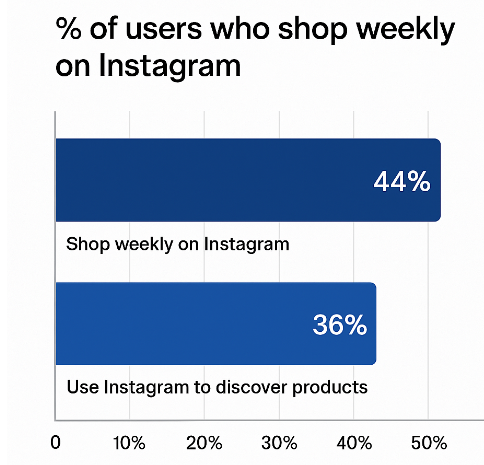
44% of Instagram users shop weekly — underscoring the platform’s purchasing strength
But not every campaign brings real sales. Success depends on how intentionally you structure your ads, audiences, and creative flow.
The Three Factors That Drive Real Sales
1. Intent‑Aligned Audiences
Targeting audiences based on genuine interest and behavioral signals consistently outperforms broad demographic targeting. In ecommerce tests, interest‑ and behavior‑based audiences generate up to 2.5× higher conversion rates compared to generic audiences. Precise audience definition ensures your budget is spent on people already leaning toward your product category.
2. Product‑Forward Creatives
Data shows that ads featuring the product within the first two seconds achieve up to 30 percent higher click‑through rates. High‑performing brands combine clean visuals, rapid value communication, and clear product angles that reveal size, texture, or functionality.
Carousel formats often produce a 1.5× stronger engagement rate for online stores because they help users explore multiple angles or variations without leaving Instagram.
3. Seamless Landing Page Flow
Even the strongest ads fail when the landing experience introduces friction. Across ecommerce benchmarks, purchase completion can drop by as much as 40 percent when load times exceed three seconds. Consistency between the ad visual, headline, and product shown reduces bounce rates and improves conversion rates.
Performance Benchmarks You Can Use
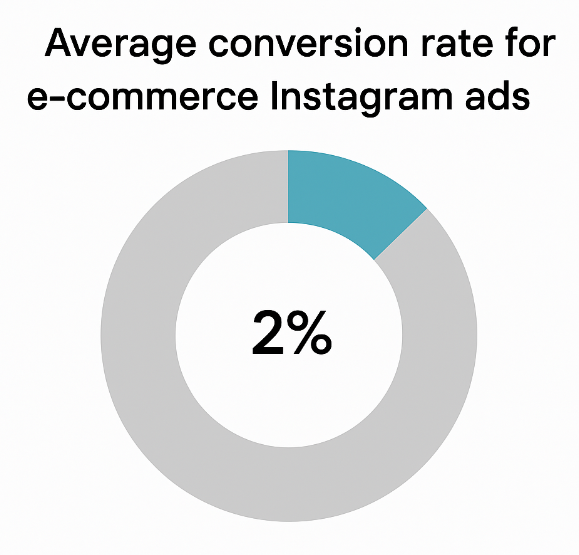
E-commerce Instagram ads typically convert at around 1.85%-2.5%
Here are useful reference metrics for online stores running Instagram ads:
-
Average CTR for ecommerce campaigns: 0.9%–1.4%
-
Typical cost per add‑to‑cart: 2–6
-
Average ROAS range for optimized product ads: 2.5–4.0
While these numbers vary by niche, they offer a reference point for evaluating whether your ads are performing within a healthy range.
Structuring a Sales‑Focused Instagram Campaign
Use Multi‑Layered Audience Sequences
Break audiences into three aligned groups:
-
Cold, interest‑based audiences
-
Warm visitors from the last 30 days
-
Hot audiences including cart abandoners and engaged users
Map Creatives to Funnel Stages
-
Upper funnel: educational videos or reels with fast hooks
-
Mid funnel: product showcases, testimonials, or carousels
-
Lower funnel: urgency, social proof, and direct product benefits
Test Only One Variable at a Time
Industry data shows that campaigns testing a single variable at once achieve optimization clarity up to 45 percent faster. Controlled testing prevents budget waste and allows meaningful scaling decisions.
Boost AOV With Cross‑Sell and Bundles
When ads promote bundles or complementary items, many ecommerce stores see a 10–20 percent increase in average order value.
Measuring What Actually Leads to Sales
Track:
-
Cost per unique landing page view
-
Percentage of add‑to‑cart events per landing page view (target: 8–12 percent)
-
Checkout initiation rate (target: 20–30 percent of ATC)
-
Purchase conversion rate (2–4 percent for most ecommerce brands)
A clear measurement framework helps identify where performance drops and where optimization is needed.
Further Reading
Here are three articles from the same blog that add depth to the topics discussed in this piece: