Understanding what “good” performance looks like has become essential as advertising platforms continue to evolve. Benchmarks provide a realistic frame of reference for evaluating your campaigns — especially when algorithmic volatility and rising competition make results less predictable. Below is a breakdown of the most important KPIs by industry, plus insights into what drives the differences.
Why Benchmarks Matter in 2025
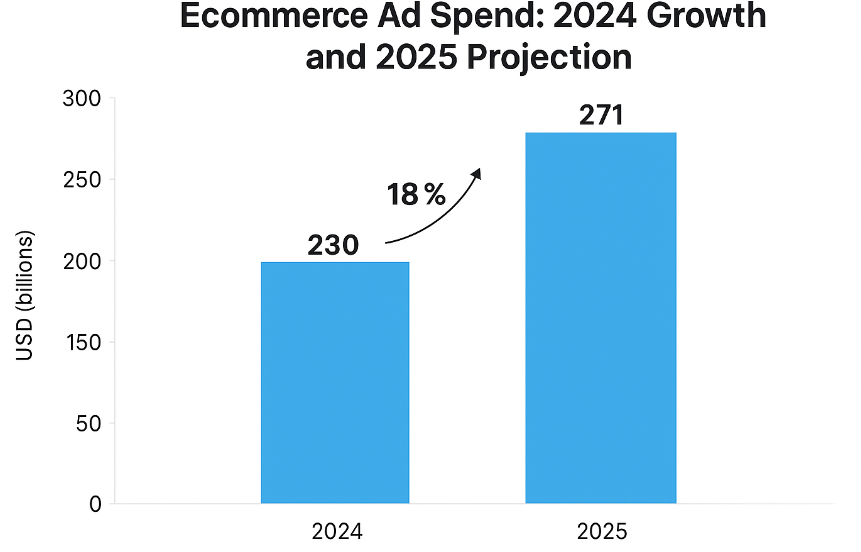
Global ecommerce ad spend growth: +18% in 2024, with projected 2025 spend of US $271 billion
Algorithms learn from averages. Without context, even strong results may appear underwhelming or vice versa. Benchmarks allow you to:
-
Set realistic CPC, CPM, CTR, and CPA expectations
-
Understand whether fluctuations are platform‑wide or campaign‑specific
-
Prioritize optimization based on the biggest gaps from industry norms
-
Avoid over‑investing in segments where diminishing returns are likely
Average KPI Benchmarks Across Major Industries
The values below are aggregated from 2024–2025 performance trends across paid social and paid search advertising.
1. Ecommerce
-
Average CTR: 1.6–2.1%
-
Average CPC: $0.80–$1.40
-
Average CPM: $11–$17
-
Average CPA: $22–$38
-
Typical ROAS: 3.2–4.1
Ecommerce remains highly competitive, but improved creative automation has pushed CTR slightly upward compared to previous years.
2. SaaS / B2B Software
-
Average CTR: 0.8–1.3%
-
Average CPC: $2.40–$5.20
-
Average CPM: $28–$42
-
Average CPL: $45–$95
-
Lead-to-customer conversion rate: 6–12%
Higher costs are driven by narrow audiences and longer decision cycles.
3. Finance & Insurance
-
Average CTR: 0.9–1.5%
-
Average CPC: $1.60–$3.10
-
Average CPM: $20–$32
-
Average CPA: $40–$75
-
Conversion rate: 5–9%
Consumers show more caution in finance‑related funnels, raising acquisition costs in 2025.
4. Education & Online Learning
-
Average CTR: 1.2–1.8%
-
Average CPC: $0.90–$1.70
-
Average CPM: $12–$21
-
Average CPL: $18–$45
-
Enrollment conversion rate: 3–6%
Short-form video has significantly improved engagement in this sector.
5. Health & Wellness
-
Average CTR: 1.7–2.4%
-
Average CPC: $0.70–$1.20
-
Average CPM: $10–$15
-
Average CPA: $18–$35
-
Subscription sign-up conversion rate: 4–8%
Lower competition and stable demand keep costs more predictable.
6. Real Estate
-
Average CTR: 0.9–1.4%
-
Average CPC: $1.20–$2.20
-
Average CPM: $16–$25
-
Average CPL: $25–$65
-
Lead-to-viewing rate: 15–28%
Regional price variability remains a major factor, with coastal markets showing higher costs.
7. Travel & Hospitality
-
Average CTR: 1.8–2.7%
-
Average CPC: $0.60–$1.10
-
Average CPM: $9–$14
-
Average CPA: $28–$50
-
Booking conversion rate: 2–4%
As travel demand recovered strongly, CPCs decreased while engagement rose.
Key Trends Shaping KPIs in 2025
1. First‑Party Data Gains Priority
Brands relying on modeled audiences saw as much as 22% higher CPCs, while those using first‑party data segments kept CPC growth below 7%.
2. Vertical Video Improves CTR
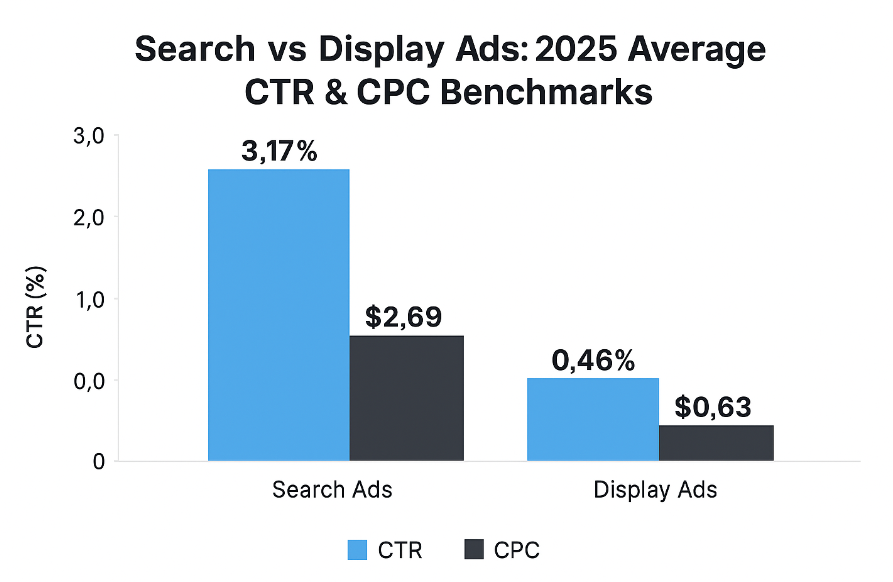
Average CTR and CPC in 2025: Search Ads outperform Display Ads in click-through and cost per click
Advertisers using vertical‑optimized video creatives experienced 10–18% higher CTR across most industries.
3. Retargeting Shrinks but Becomes More Efficient
Due to privacy constraints, retargeting audiences are smaller, but improved algorithms increased retargeting conversion rates by 12–20% year‑over‑year.
How to Use These Benchmarks
-
Identify KPIs where you underperform and prioritize those areas for optimization.
-
Compare funnel stages rather than only final metrics.
-
Track trends quarterly, not monthly, to avoid misinterpreting algorithmic shifts.
-
Avoid copying benchmarks blindly — industry averages apply differently depending on your funnel structure, region, and creative maturity.