Multi-touch attribution (MTA) helps marketers understand how different interactions contribute to a final conversion. Instead of giving full credit to the first or last touch, MTA distributes value across multiple touchpoints, offering a clearer picture of what truly drives results. As customer journeys become more complex across channels and devices, relying on single-touch models is increasingly ineffective.
According to a recent analysis, 67% of marketers say customer journeys now involve at least four channels. Another study shows that using multi-touch attribution can improve budget efficiency by up to 30% because it highlights under- and over-performing channels.
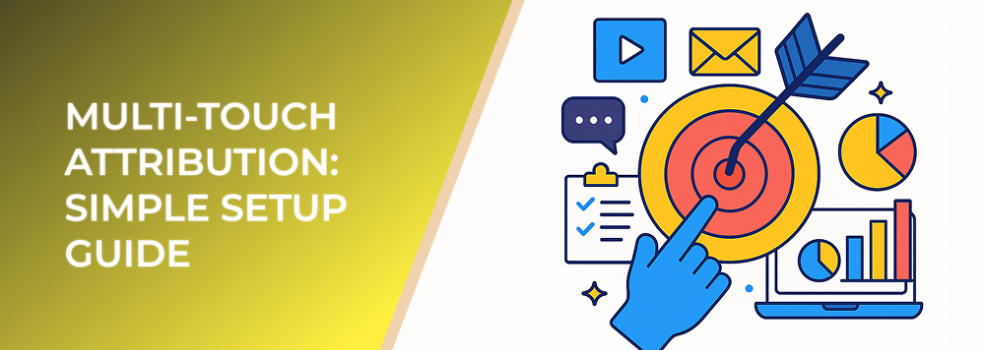
This guide provides a step-by-step approach to implementing MTA, even with limited resources.
Step 1: Map the Customer Journey
Begin by listing out every touchpoint where a user interacts with your brand.
Common touchpoints include:
-
Social media ads
-
Email sequences
-
Website pages
-
Retargeting campaigns
-
Search ads
A clear journey map ensures accurate event tracking and prevents data gaps. A survey found that companies that formally document customer journeys are 2.3x more likely to exceed lead generation goals.
Step 2: Set Up Unified Tracking
Multi-touch attribution depends on consistent and connected data.
To prepare:
-
Use consistent UTM parameters across all channels
-
Ensure event tracking is active on website and landing pages
-
Connect performance data from paid channels, CRM, and analytics tools
For example, businesses that use standardized UTMs report 38% more accurate campaign-level insights.
Step 3: Choose Your Attribution Model
There is no one-size-fits-all model. The right choice depends on your goals and the length of your customer journey.
Linear Model
Gives equal credit to all touchpoints. Best when each interaction plays a similar role.
Time-Decay Model
Gives more credit to interactions closer to conversion. Works well for long or research-heavy journeys.
Position-Based Model

Splits credit between early and late touches (e.g., 40/40/20). Great for funnels where discovery and closing matter most.
Research shows that companies using position-based models tend to attribute 22% more value to awareness campaigns compared to last-click setups.
Step 4: Build a Simple Attribution Dashboard
Start with a lightweight reporting setup. Focus on what matters most—channel influence and conversion paths.
Your dashboard should include:
-
Top converting paths
-
Credit distribution per channel
-
Cost per attributed conversion
-
Assisted conversions
Marketers who visualize multi-touch paths see a 19% improvement in cross-channel budget allocation.
Step 5: Iterate and Adjust
The value of MTA comes from continuous refinement. Once the initial setup is running:
-
Compare results with your previous single-touch model
-
Identify channels receiving too much or too little credit
-
Adjust spend gradually and monitor outcomes
One study showed that teams using ongoing attribution optimization saw conversion rates rise by 12% within six months.
Recommended Next Reads
Here are three related articles from the library:
