Digital competition is rising, CPMs are climbing, and audiences are fragmenting. Yet many advertisers continue using the same basic demographic and interest targeting they set up years ago. Meta’s ad delivery has grown smarter, but it still relies heavily on the inputs advertisers provide. Better data in means better results out.
A recent performance study found that advertisers who use layered, behavior-based targeting see up to 37 percent higher conversion rates compared to those relying on broad demographics alone. This gap continues to widen as users spread their attention across more platforms and niche communities.
Feature 1: Hidden Behavioral Micro‑Segments
Behavioral data inside Meta’s system includes hundreds of granular traits that hint at intent: purchase behavior, device patterns, travel habits, and marketplace interactions.
Most advertisers only use a fraction of these options because they sit deeper in the interface. Yet these micro-segments consistently outperform broad interest audiences.
Useful statistic: Campaigns using behavior-led micro-segmentation have shown a 28 percent reduction in cost per acquisition compared to standard interest targeting.
How to apply it
-
Combine a core interest with two behavioral qualifiers.
-
Separate mobile vs. desktop behavior to tighten relevance.
-
Use travel or marketplace activity to infer readiness to buy.
Feature 2: Audience Overlap Diagnostics
Many advertisers unknowingly target the same users across multiple ad sets, which drives frequency up and efficiency down.
Audience overlap diagnostics can reveal hidden cannibalization. Reducing audience overlap is one of the fastest ways to stabilize CPMs.
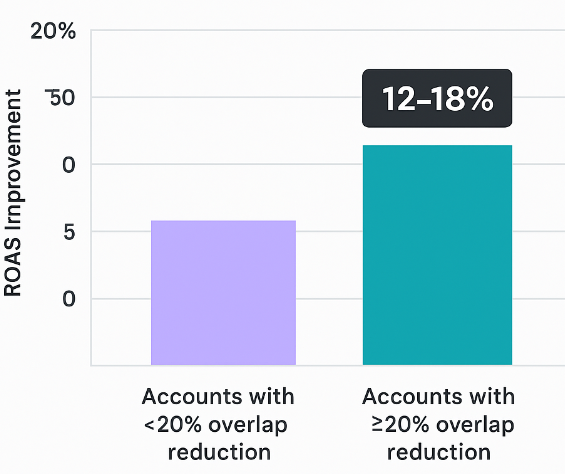
Useful statistic: Accounts that reduce overlap by at least 20 percent typically see a 12–18 percent improvement in ROAS.
How to apply it
-
Split audiences by intent tiers rather than demographics.
-
Exclude previously engaged segments from prospecting sets.
-
Rebuild top-of-funnel and mid-funnel structures to avoid duplication.
Feature 3: Post‑Engagement Behavior Insights
Meta’s engagement data extends beyond likes and follows. It includes signals such as comment depth, share behavior, saves, and repeated profile visits.
These signals help distinguish passive scrollers from users who show strong intent and are more likely to convert.
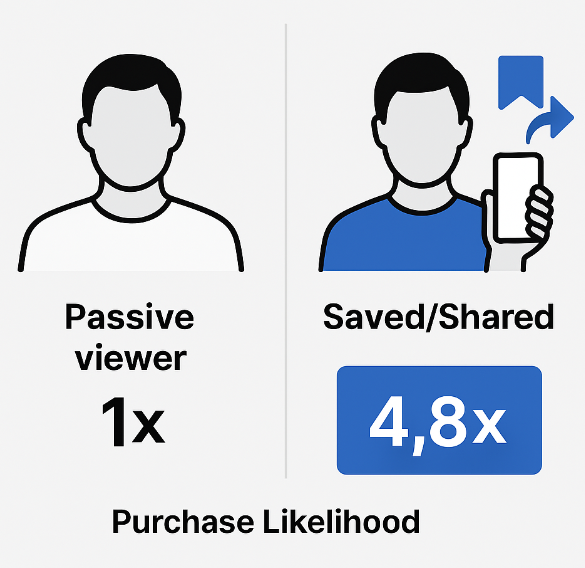
Useful statistic: Users who save or share content are 4.8 times more likely to complete a purchase compared to non‑engaged viewers.
How to apply it
-
Build retargeting segments based on meaningful engagement.
-
Differentiate users who watched 75 percent of a video from those who watched 3 seconds.
-
Test creative variations aligned with different engagement tiers.
Feature 4: Hidden Lookalike Quality Controls
Most advertisers create standard lookalikes and stop there. However, deeper quality controls exist: filtering source audiences by recency, value, engagement type, or funnel stage.
High-quality seeds transform lookalike performance dramatically.
Useful statistic: Lookalike audiences built from high‑value converters show up to 52 percent more efficient cost per conversion than standard lookalikes.
How to apply it
-
Rebuild your seed audience every 30–60 days.
-
Use only the top 10–20 percent of converters by value.
-
Create tiered lookalikes (1 percent, 2 percent, 3 percent) to scale efficiently.
Suggested Reading
Here are three additional articles that complement the strategies discussed above: