If you’re running paid campaigns and juggling data from multiple platforms, chances are you’ve had this thought:
Where exactly are my conversions really coming from?
Attribution can feel messy, especially when Meta, Google, TikTok, and your CRM all disagree on what produced a sale. A simple attribution dashboard won’t magically unify everything, but it will give you a clear, reliable view of what’s creating real impact. And no, you don’t need advanced BI tools to get started.
Let’s break it down — cleanly, simply, and in a way any marketer can follow.
What Is an Attribution Dashboard?
An attribution dashboard is a centralized view that shows how different channels and campaigns contribute to your conversions. It helps you connect the dots between ad spend and outcomes, instead of jumping between platforms and guessing which report is “the truth.”
A good dashboard cuts through noise and focuses on the metrics that matter most for decision‑making. If you’ve ever wondered why performance reports often feel inconsistent, especially after iOS changes, this guide on Meta Ads attribution accuracy, windows, and delays helps illustrate why attribution dashboards are now essential.
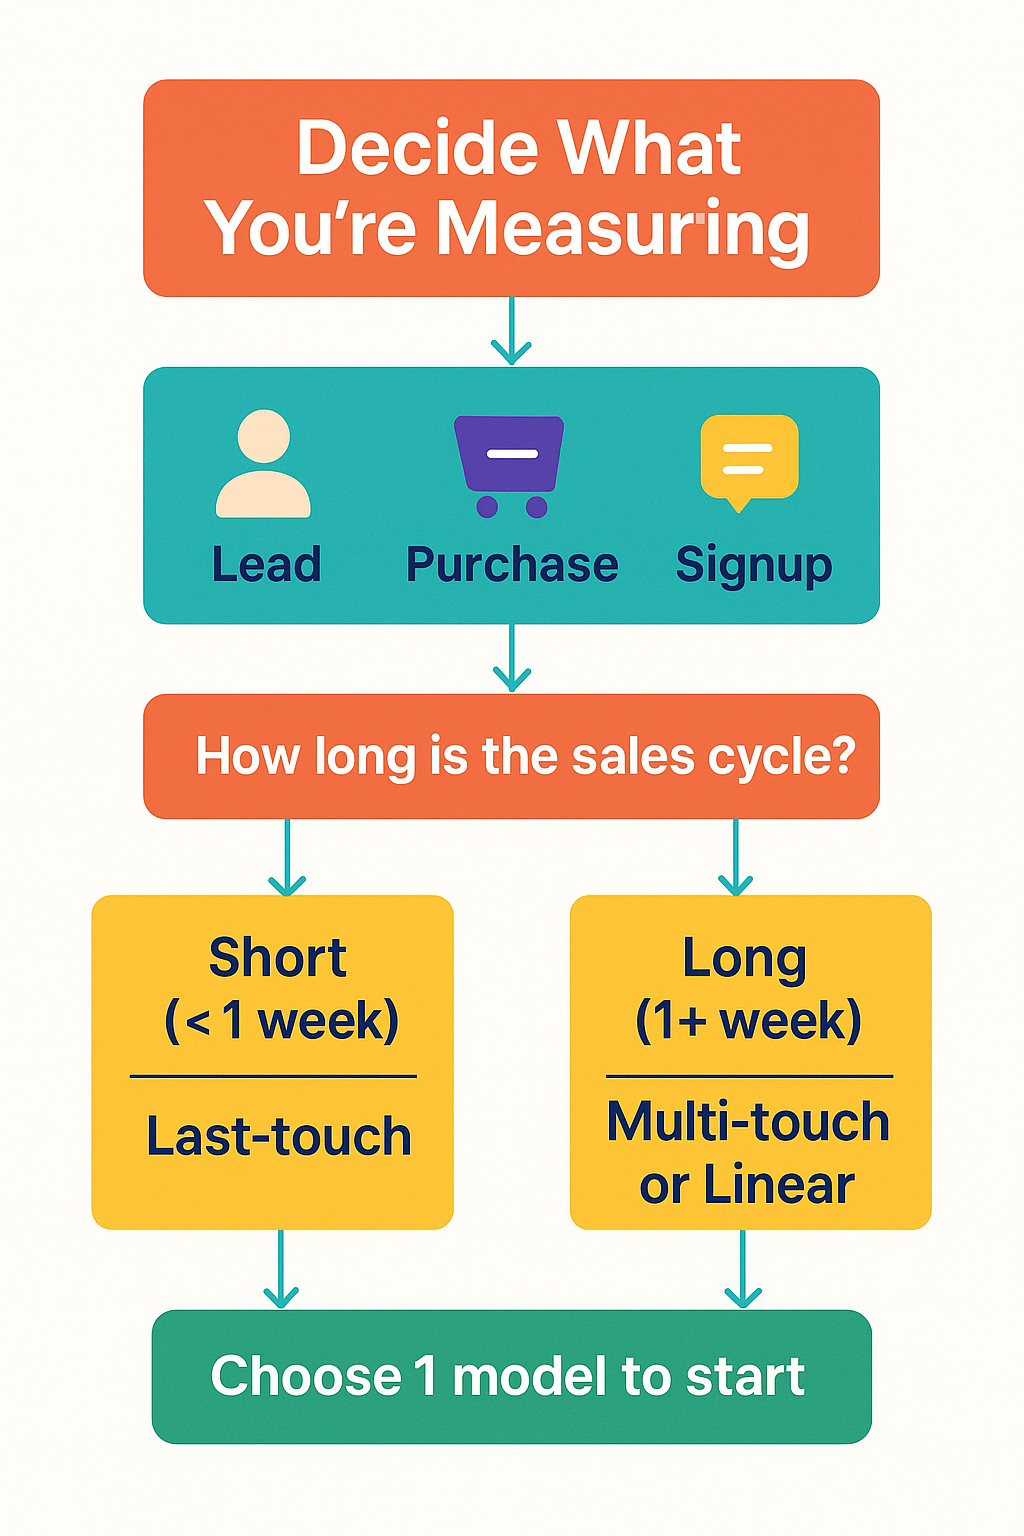
Step 1: Decide What You’re Measuring
Before touching a spreadsheet or Looker Studio template, pause and get clarity.
Ask yourself:
-
What’s the primary conversion?
-
Are we tracking purchases, leads, bookings, or something deeper in the funnel?
-
Do we need first‑touch, last‑touch, or something in between?
-
How long is our sales cycle?
If you’re unsure what matters most to your decision‑making, check this breakdown of which ad metrics actually matter when optimizing campaigns. It will help you prioritize which numbers deserve a place in your dashboard.
Start with one conversion event and one attribution model. You can expand once you’ve validated the structure.
Step 2: Collect the Right Data
Your attribution dashboard is only as clean as the data feeding it. That means:
-
UTMs on every link.
-
A tracking system (GA4, Meta Pixel, CRM events).
-
Consistent naming conventions.
-
A location to unify the data.
Your UTMs should include: utm_source, utm_medium, utm_campaign, plus utm_term or utm_content if needed.
If you’ve ever looked at two ad platforms reporting different numbers, it’s not a glitch — it’s how attribution works. This walkthrough on using Facebook’s Attribution Tool to refine your ad strategies is an excellent complement to this step.
Step 3: Choose Your Dashboard Tool
You don’t need a premium analytics suite to build something useful. Start lightweight:
-
Google Looker Studio — free, flexible, good for visualizing blended performance.
-
Google Sheets — excellent for prototypes or manual channel mapping.
-
Excel — great for teams who prefer offline analysis.
-
Optional connectors like Supermetrics — helpful but not mandatory.
The goal here isn’t sophistication. It’s clarity.
If you need help interpreting funnel performance, this full‑funnel analytics guide on going beyond ROAS pairs perfectly with building attribution dashboards.
Step 4: Map the Data
This is where your dashboard starts taking shape. Keep it simple.
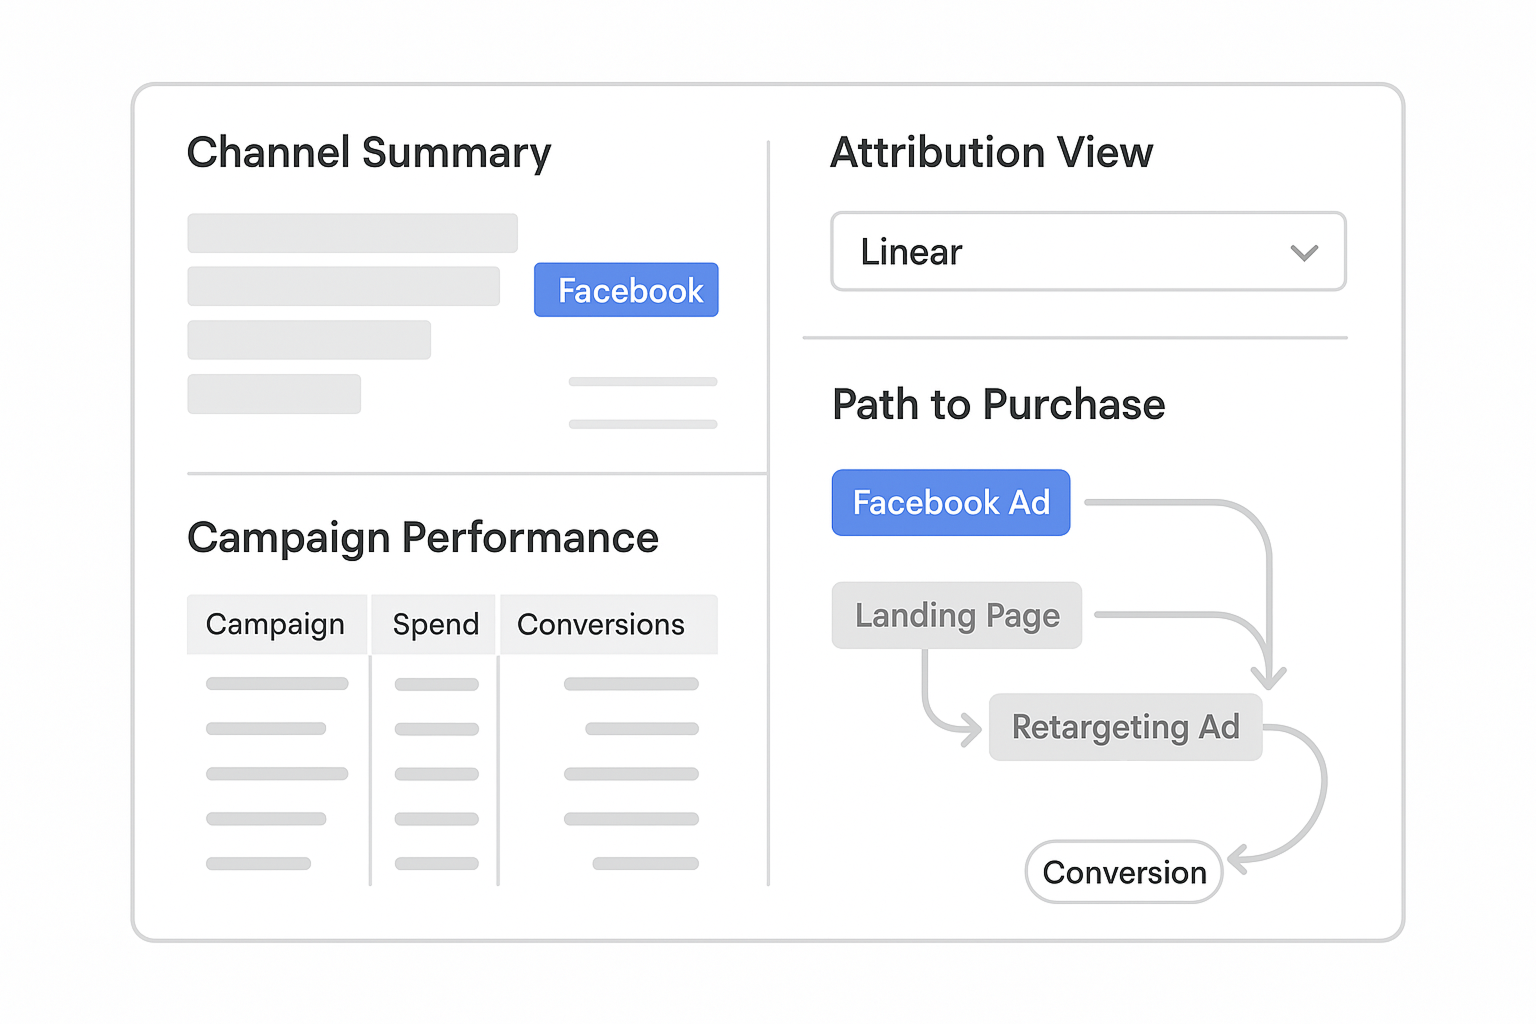
What to Include
-
Channel Summary
-
Sessions, conversions, revenue, CPA.
-
Grouped by
utm_source.
-
-
Campaign Performance
-
Compare
utm_campaignacross channels. -
Monitor spend vs. results.
-
-
Attribution Model Comparison
-
Last‑click vs. first‑click vs. linear.
-
Helps reveal assisting campaigns.
-
-
Top Converting Paths
-
Useful for spotting multi‑step journeys.
-
Great for optimizing retargeting sequences.
-
Many advertisers assume their “best” ads are the ones with the highest engagement or prettiest creative. Often, attribution reveals a different truth, and this article — Why Your Facebook Ads Look Great But Still Don’t Sell — explains exactly why.
The goal is not to add more charts. It’s to create a view that actually answers questions.
Step 5: Use the Dashboard Consistently
A dashboard is only useful if you use it. Set a weekly review and ask:
-
Which channels drive the most assists?
-
Which campaigns close the final conversion?
-
Where is spend high but contribution low?
-
Do creative changes shift the attribution pattern?
Good dashboards spark better questions. And better questions lead to better decisions.
Attribution isn’t perfect — and it doesn’t need to be. The point is direction, not precision.
Attribution Without the Overwhelm
You don’t need enterprise tools to understand where your conversions come from.
A simple attribution dashboard — clean UTMs, clear metrics, and a disciplined workflow — gives you the clarity you need to scale smarter and avoid waste.
Build small, iterate fast, and keep your focus on the numbers that influence real decisions.