
Short-term optimization answers questions like “Which ad set won today?” Long-term performance modeling answers tougher questions:
-
What is the real payback of each channel after returns, churn, and repeat purchases?
-
How much incremental profit does an extra dollar create at different spend levels?
-
Which improvements are durable (pricing, onboarding, retention) versus fragile (temporary creative spikes)?
-
How do seasonality and macro shifts change expected results?
If you’ve ever seen a campaign look profitable in-platform but disappoint on the P&L, you’ve met the gap long-term models are designed to close.
A useful reality check: Nielsen reported that 85% of marketers said they were confident in their ability to measure ROI, while only 32% measured ROI holistically across channels (Nielsen, 2025). Long-term performance models exist to close that kind of gap.
The outcomes you should expect
A mature long-term model gives you:
-
Decision-grade unit economics (LTV, CAC, payback, contribution m(Nielsen)tality-aware channel measurement (what moved because of marketing vs what would have happened anyway).
-
Forecasting you can operate (weekly inputs → monthly/quarterly outcomes).
-
A budgeting engine (where to add or pull spend with quantified confidence).
-
A shared language across marketing, analytics, and finance.
Step 1: Define one truth metric and two guardrails
Start with a metric your business can actually bank:
-
Primary truth metric: contribution margin dollars, gross profit, or net revenue (preferred over ROAS).
-
Guardrail 1: payback window (e.g., “CAC payback ≤ 9 months”).
-
Guardrail 2: retention/quality (refund rate, churn, repeat purchase rate).
Why not just ROAS? ROAS ignores margin, returns, and timing of cash flows.
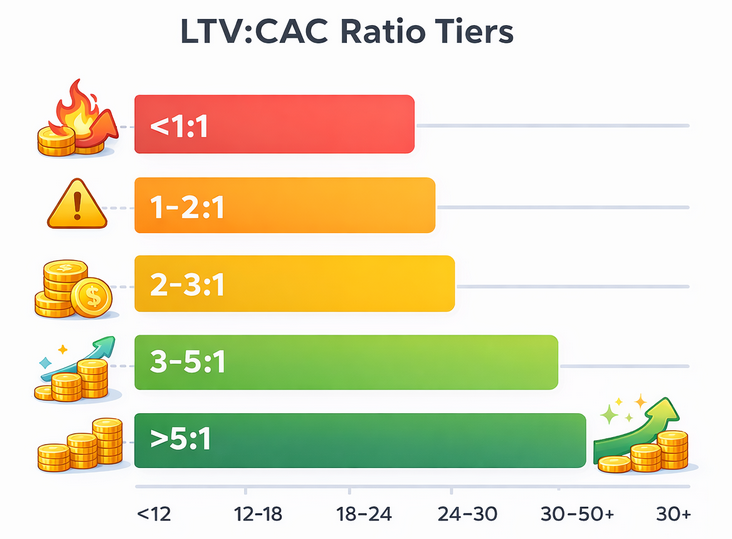
Benchmark ranges for customer lifetime value to customer acquisition cost (LTV:CAC) ratios, where 3:1 or higher generally indicates healthy long-term economics
Useful benchmark: CAC payback varies widely by business model, pricing, and margin structure, but a finance benchmark often cited puts median CAC payback around 16 months (Drivetrain, 2024). Even if your business isn’t subscription-based, the lesson holds: long-term models must account for time-to-payback, not just immediate conversions.
Step 2: Build a measurement map (what you can know vs what you must infer)
Create a one-page map with three layers:
1) Observable (high confidence)
-
Orders, r(Drivetrain)unds/returns
-
Subscription status and churn
-
Onsite events (view, add-to-cart, checkout)
2) Modeled (medium confidence)
-
Cross-device and cross-session attribution
-
Assisted conversions
-
Offline conversions and delays
3) Causal (needs experimentation or MMM)
-
Incremental lift by channel
-
Halo effects and brand impact
-
Long-lag effects (weeks/months)
This map prevents a common trap: treating attributed conversions as causal truth.
Step 3: Fix your “time problem” before you model anything
Long-term performance is mostly a timing problem:
-
Conversion delay: clicks today, purchases next week.
-
Value delay: purchase today, margin realized later; LTV realized over months.
-
Signal delay: data completeness takes time (refund windows, chargebacks, return cycles).
What to do: define standard windows and keep them consistent.
-
Attribution window (operational): what you’ll use to steer week-to-week.
-
Revenue recognition window (financial): when value is considered “real.”
-
Cohort window (modeling): 30/60/90/180-day value tracking.
Then report performance at multiple “maturity” points (e.g., 7-day, 30-day, 90-day), so you stop overreacting to early noise.
Step 4: Create a cohort LTV model (your foundation)
A cohort model is the backbone of long-term performance.
What to track per cohort
Define cohorts by acquisition week (or day), channel, and optionally offer/segment. Track:
-
Customers acquired
-
Revenue to date
-
Gross margin to date
-
Refunds/returns
-
Repeat purchases / renewals
-
Churn and reactivation
A simple, durable LTV approach
-
Gross margin LTV (to day N) = cumulative gross margin from the cohort through day N.
-
Net LTV = gross margin LTV − variable costs (support, payment fees, logistics, etc.).
-
Contribution LTV = net LTV − marketing cost to acquire the cohort.
If you’re subscription-based:
-
LTV (gross margin) ≈ ARPA × gross margin % ÷ churn rate
If you’re ecommerce:
-
LTV ≈ AOV × purchase frequency × gross margin % × average customer lifespan
Modeling the “tail” (where most long-term value hides)
Most cohorts aren’t fully mature when you need to make decisions. You need a tail assumption.
Two practical options:
-
Curve fitting: fit a retention/value curve to forecast beyond observed days.
-
LTV multipliers: if historically day-30 value is 55% of day-180 value, estimate:
LTV180 ≈ LTV30 ÷ 0.55
Pick one approach and recalibrate it consistently as new cohorts mature.
Step 5: Convert the cohort model into payback and scaling models
Now turn the cohort view into decision rules.
CAC payback curve
For each cohort:
-
Plot cumulative contribution margin by day.
-
Plot CAC as a horizontal line.
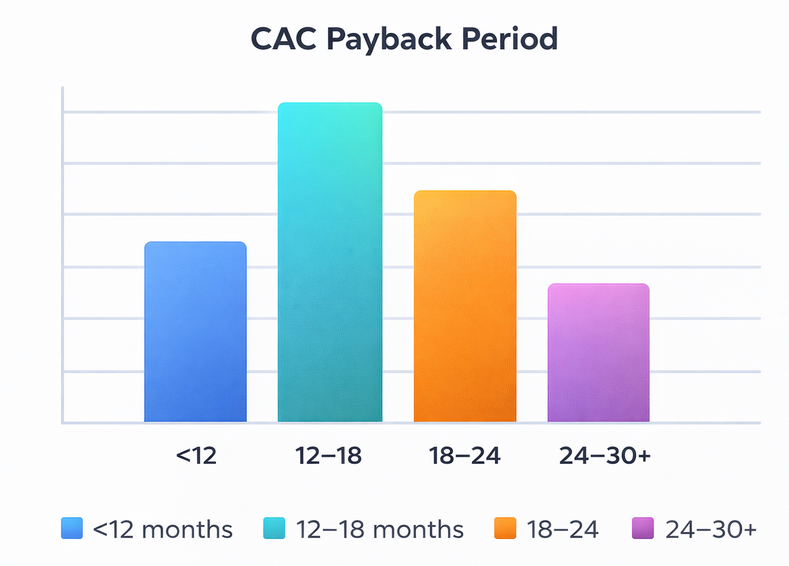
Distribution of CAC payback periods showing the median around 16 months and many companies taking 20–30+ months to recoup acquisition costs
Payback day is when the curve crosses CAC.
Marginal returns curve (the scaling truth)
Performance changes with spend. Instead of averaging, model marginal outcomes:
-
Marginal profit per dollar at spend tiers (e.g., $5k/week, $10k/week, $20k/week).
-
Keep it weekly so the model stays operational.
Output should look like:
-
“The next $1,000 in Channel A is expected to yield $X in contribution margin by day 90.”
Step 6: Add an incrementality layer (so you don’t fund illusions)
Long-term models fail when they assume attribution equals causation.
Minimum viable incrementality program
Run experiments that answer: “What happens if we stop or reduce a lever?”
Options:
-
Geo tests (hold out regions)
-
Audience holdouts (randomized suppression)
-
Budget-based lift tests (controlled spend changes)
Use experiments to estimate an incrementality factor per channel:
-
Incremental value = attributed value × incrementality factor
Start with broad ranges (e.g., 0.4–0.8) and narrow them as you run more tests.
Why this matters now
Privacy changes reduced deterministic tracking, increasing reliance on modeled attribution. For example, Branch reported global iOS ATT opt-in around 13.85% in 2024 (Branch, 2025). When opt-in is low, platform-reported conversions and last-click models become less reliable—making cohort economics and incrementality checks far more important.
Step 7: Use Marketing Mix Modeling for cross-channel, long-horizon effects
MMM is best when:
-
You spend across multiple channels
-
You have seasonality and promotions
-
You suspect halo effects (brand search, retail, offline)
A practical hybrid approach:
-
Cohort model estimates(Branch)by channel at the customer level.
-
MMM estimates incremental impact at the market/time-series level.
-
Reconcile them by aligning totals to financial reality (revenue and margin).
Nielsen’s ROI research has suggested that closing measurement gaps can unlock large improvements; one report cited a median 50.3% ROI improvement among marketers who close the gap (Nielsen, 2022). Your lift may be smaller, but the point is consistent: better measurement can return disproportionate value.
Step 8: Build forecasts that respect uncertainty
A long-term model is not a single number. It’s a range.
Use three scenarios
-
Base case: expected values
-
Downside: conservative (higher churn, lower conversion, higher costs)
-
Upside: optimistic
Propagate uncertainty through the model
Key inputs that should be ranges:
-
Conversion rate
-
AOV / ARPA
-
Incrementality factor
-
Spend response (diminishing returns)
Deliver forecasts like:
-
“At $20k/week, expected day-90 contribution margin is $95k–$125k.”
That’s more actionable than pretending the answer is $110k.
Step 9: Operationalize the model (so it doesn’t rot)
Models degrade when:
-
tracking changes
-
product/offer changes
-
channel mix changes
-
seasonality shifts
Establish a monthly maintenance ritual
-
Refit LTV curves with newly mature cohorts
-
Re-estimate incrementality factors using the latest tests
-
Check for breakpoints in spend response curves
-
Update costs (fees, fulfillment, COGS)
Governance: define ownership
-
Marketing owns: campaign taxonomy, experiments, interpretation
-
Analytics owns: pipelines, model logic, QA
-
Finance owns: margin definitions, revenue recognition, sign-off
Step 10: Common mistakes (and what to do instead)
Mistake 1: Modeling revenue, not margin
Fix: model contribution margin. Revenue is vanity when returns, discounts, and COGS swing.
Mistake 2: One attribution window for everything
Fix: use maturity curves (7/30/90-day) and reconcile to finance.
Mistake 3: Treating averages as scaling truth
Fix: build marginal response curves at spend tiers.
Mistake 4: Ignoring lag and seasonality
Fix: include lagged variables in MMM and monitor cohort maturity.
Mistake 5: No incrementality checks
Fix: run recurring holdouts and adjust channel value using incrementality factors.
A simple template to start this week
If you want a minimal setup that still works:
-
Define your truth metric (contribution margin) and payback window.
-
Create cohorts by acquisition week and channel.
-
Track day-7, day-30, day-90 gross margin per cohort.
-
Compute CAC and payback day.
-
Estimate LTV tail using multipliers (day-30 → day-180).
-
Run one holdout test monthly and update incrementality factors.
-
Forecast next month’s spend using three scenarios.
Do this for 8–12 weeks and you’ll have a model that guides budget decisions with far less guesswork.