Most B2B marketers track the basics: impressions, leads, cost per click. But very few of those metrics actually predict revenue.
This matters, especially if you're spending on Meta platforms like Facebook and Instagram, where signals can be noisy. Clicks and conversions don’t always mean sales. And when campaigns look good on paper but fail to deliver pipeline, the issue is often in what you’re measuring.
Below, we’ll cover which KPIs actually help you forecast revenue growth and which ones create a false sense of performance.
Why Standard KPIs Often Mislead in B2B
If you're selling to businesses, you're not optimizing for instant purchases. You're trying to influence longer sales cycles, buying committees, and more complex decisions. That changes which signals matter.
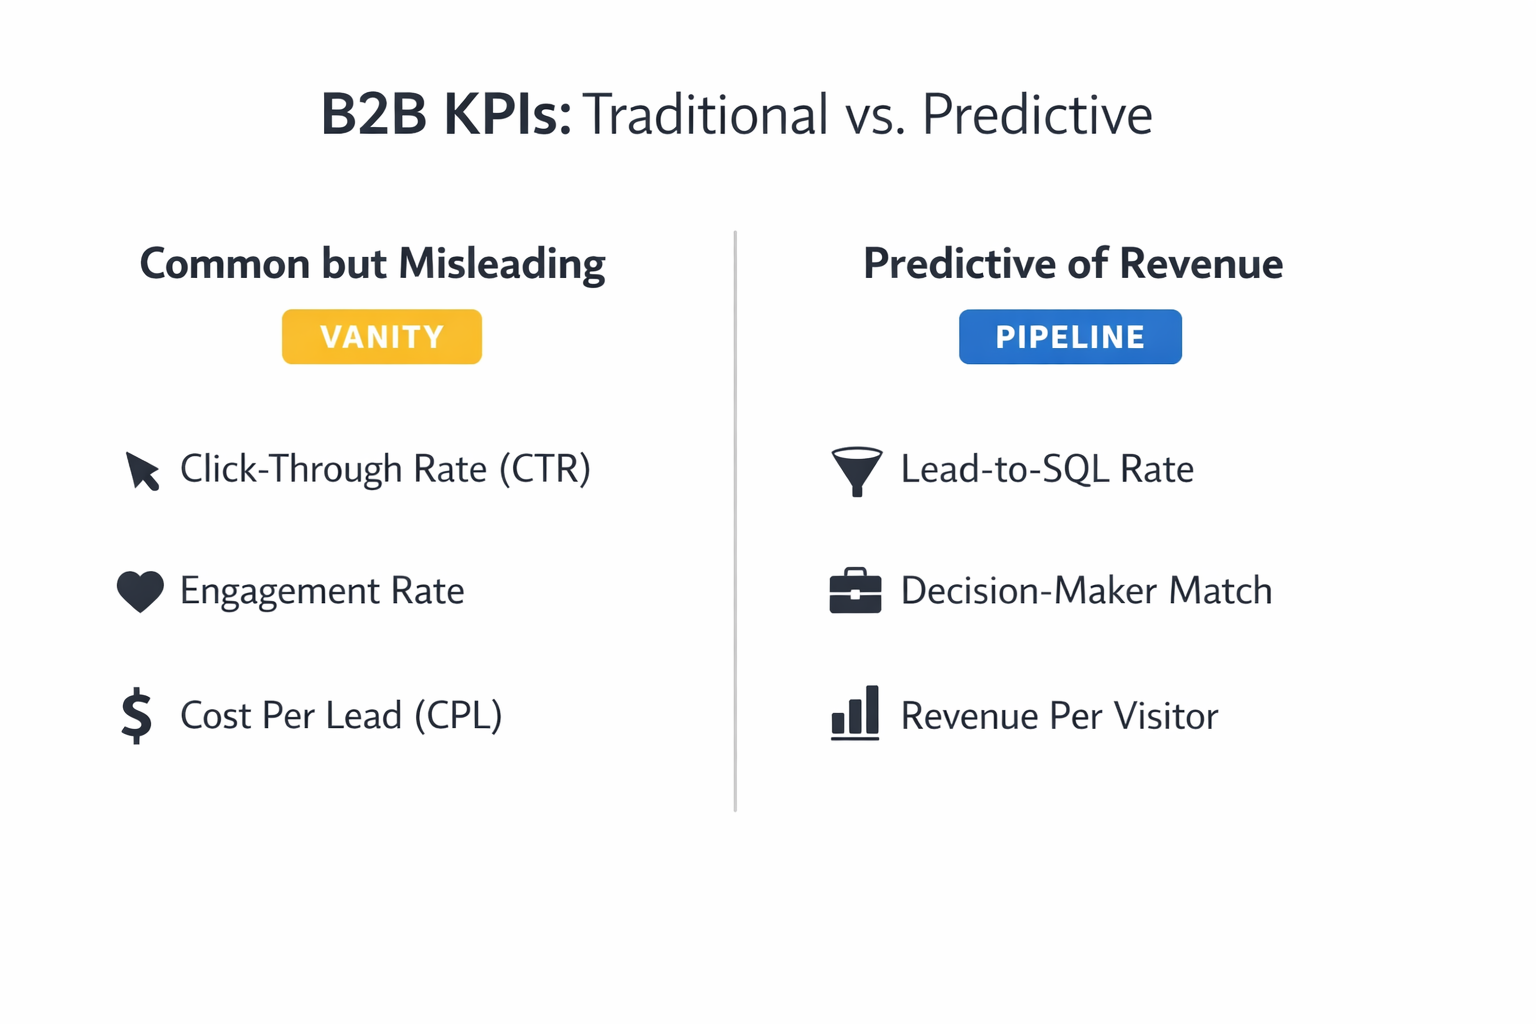
Here’s where common KPIs fall short:
-
Cost per lead (CPL) often favors quantity over quality;
-
Click-through rate (CTR) can reward curiosity, not intent;
-
Engagement rate has little correlation with pipeline if the wrong people are engaging.
To move beyond surface-level metrics, you need to track behaviors that reflect sales readiness and actual buying progress.
B2B KPIs That Signal Real Revenue Potential
1. Lead-to-SQL Conversion Rate, Broken Down by Campaign
This tells you how many ad-generated leads actually become sales-qualified — and which campaigns are driving that shift.
It helps you:
-
Spot creative or audiences that attract real decision-makers;
-
Cut spend on high-volume, low-quality campaigns;
-
Benchmark how different offers convert across funnel stages.
Tracking this consistently helps you stop optimizing for the cheapest leads and start optimizing for the ones that move forward.
Related: Targeting the Right Decision-Makers in B2B Facebook Ads
2. Sales Cycle Length, Starting From the First Ad Interaction
This KPI measures the average number of days between a person’s first ad touch and when they enter your CRM as an opportunity.
Why it matters:
-
A shorter cycle often means better message-market fit;
-
It shows whether your ad content is accelerating understanding and intent;
-
It’s useful for comparing audiences — for example, cold lookalikes versus retargeted visitors.
Use UTMs or offline conversions to tie Meta ad clicks back to opportunity timestamps.
3. Return Session Rate (Multi-Touch Journey Tracking)
Most B2B buyers don’t convert in a single visit. This KPI tracks how many users return to your site and complete key steps later — like reading a case study, visiting your pricing page, or booking a demo.
This helps you:
-
Identify which audiences are actually researching, not just clicking;
-
Understand which landing pages are effective in nurturing interest;
-
Detect drop-off points that hurt downstream conversion.
Return sessions are an early sign of deeper intent, even if the form fill comes later.
4. Decision-Maker Match Rate
This metric tracks how many of your website visitors or ad converters match your ideal buyer personas — based on job titles, seniority, or function.
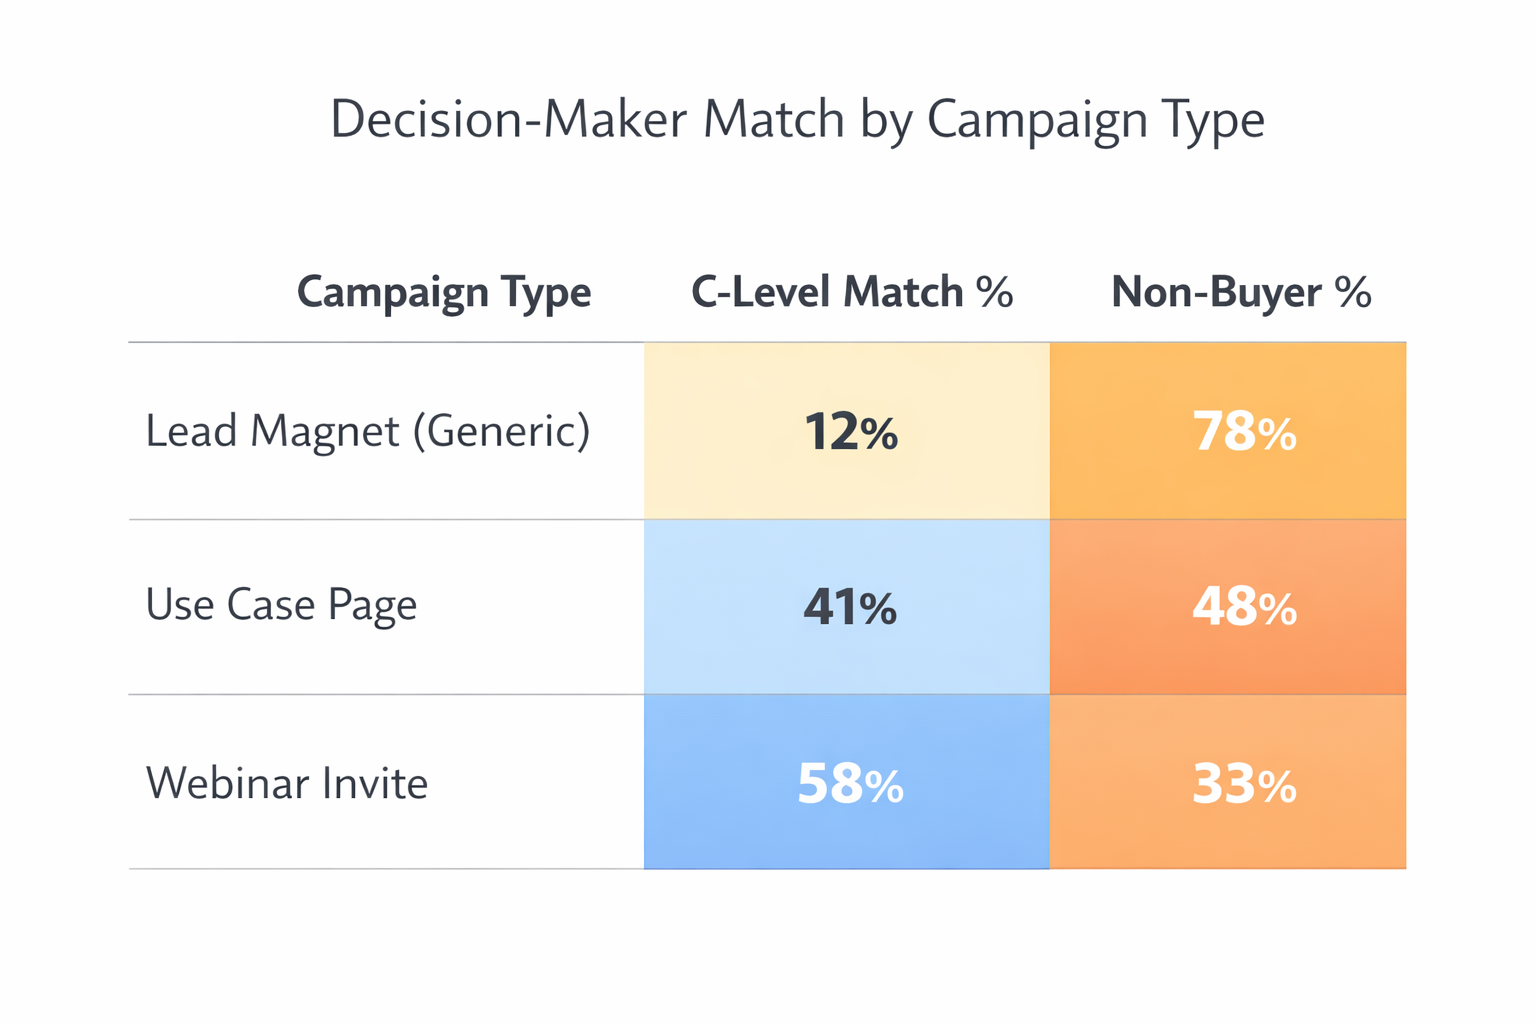
Some campaign formats naturally attract more decision-makers. Webinar invites and use case pages outperform generic lead magnets in C-level match rates.
You can enrich this data by:
-
Syncing LinkedIn data for retargeted users;
-
Using Clearbit or similar tools to identify visitor profiles;
-
Tagging sessions by job level where possible.
If you're converting junior-level roles or irrelevant functions, your targeting or messaging likely needs a reset.
5. Revenue per Paid Visitor (Not Just ROAS)
Instead of looking at return on ad spend (ROAS) in isolation, break it down further by calculating how much revenue each visitor from Facebook or Instagram generates on average.
Why this is useful:
-
It accounts for both volume and value, not just cost;
-
It helps you compare paid social against other traffic sources;
-
It reduces noise from AOV swings or lead delays.
To calculate: divide total attributed revenue by the number of unique paid visitors.
Related: Data-Driven Decisions: What Facebook Metrics Actually Predict Conversions
Patterns That Matter — Even If They Aren’t Classic KPIs
Some signals don’t show up in dashboards but can still tell you a lot about pipeline health.
Look for:
-
A drop in return traffic from warm audiences — this can signal a loss of interest before conversions start falling;
-
A spike in clicks from the same domain — a likely sign that multiple stakeholders at a company are evaluating you;
-
Creative performance changes ahead of lead quality drops — often, the right people stop responding before volume dips.
Adding these to your reporting gives you better early warning signals than most standard metrics.
Turning KPIs Into Revenue Feedback Loops
A good KPI isn’t just a score. It should feed back into your targeting, creative, and budget decisions.
In B2B, this means:
-
Feeding closed-won data back into custom audiences;
-
Shifting spend to campaigns that produce faster-moving leads;
-
Pausing campaigns that generate MQLs but no qualified conversations.
The goal isn’t to report more. It’s to act faster — with fewer false positives and fewer wasted weeks.