Reducing your CPL doesn’t require a full funnel rebuild. With a structured two‑week optimization plan, you can eliminate wasted spend, increase relevance, and boost the conversion rate of every ad you run. Here is a precise day‑by‑day framework to achieve measurable results quickly.
Day 1–2: Diagnose What’s Driving High CPL
Start with an audit across your targeting, creatives, placements, and landing experience.
-
Identify audiences with low CTR or low relevance metrics.
-
Review placements overspending without conversions.
-
Assess landing page load time. A delay from 1 second to 3 seconds can increase bounce probability by 32%.
-
Check conversion flow friction: too many fields, unclear value props, or weak CTAs.
Day 3–4: Tighten Audience Targeting
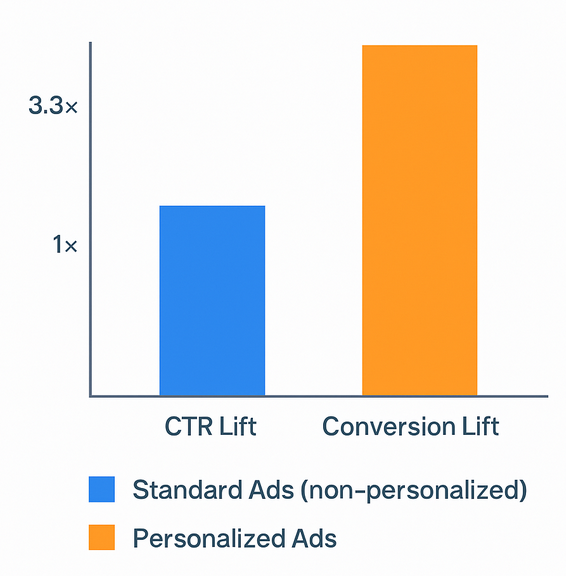
Personalized ads drive significantly higher engagement — roughly 3.3 × higher CTR than generic ads
Broader doesn’t always mean cheaper. Shift your budget toward segments with clear intent.
-
Use lookalike or modeled audiences built from high‑value conversions.
-
Exclude past converters and low‑intent segments.
-
Prioritize retargeting windows where intent is highest. Warm audiences often convert up to 3–4 times better than cold traffic.
Day 5–6: Refresh and Split‑Test Creatives
Creative fatigue can increase CPL rapidly. Launch new variants and run A/B tests.
-
Test different hooks, offers, visuals, and formats.
-
Vertical or mobile‑optimized video ads often show 10–12% higher conversion rates.
-
Add social proof elements. Visitors who interact with product ratings and reviews convert at over 2x the baseline.
Day 7–9: Optimize the Offer and Landing Page
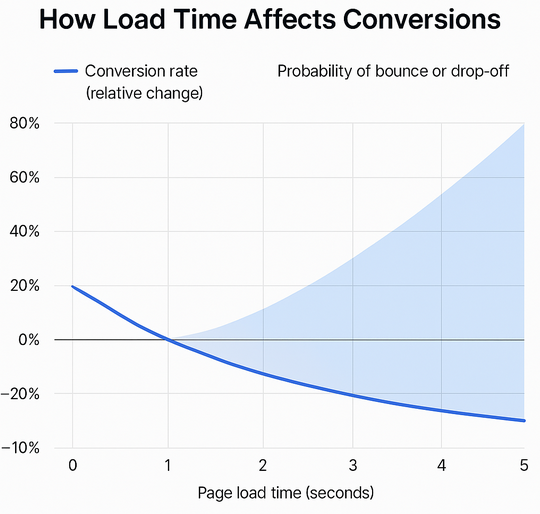
How load time affects conversions — every extra second up to 5 s reduces conversion rate by ~4.4%, while bounce risk climbs sharply from 1 s to 3 s
If your offer is unclear or too weak, no ad optimization will lower CPL meaningfully.
-
Clarify value proposition above the fold.
-
Shorten forms or prefill fields.
-
Heatmaps often show that 50–70% of users never scroll—optimize your top section accordingly.
-
Improve page speed. Conversion rates tend to decline steadily as load time moves from 0 to 5 seconds.
Day 10–12: Shift Budget to Best‑Performing Segments
Once data stabilizes, reallocate spend.
-
Pause high‑spend, low‑conversion audiences.
-
Move budget to audiences with strong CTR and conversion rates.
-
Prospecting ROAS might average 2.5 while retargeting can reach 3.6—use this to estimate improvement potential.
Day 13–14: Scale Winners and Retest
Final adjustments focus on reinforcing proven combinations.
-
Scale the campaigns with lowest CPL and highest conversion rate.
-
Refresh winning creative variations to prevent fatigue.
-
Launch a second round of micro‑tests to keep CPL low long term.
Useful Statistics for Context
-
Average landing page speed impacts conversions significantly: a 1‑second delay can drop conversion rates by up to 7%.
-
Personalization lifts ad CTR by over 10% when feed‑based or dynamic content is used.
-
Carousels on Instagram show engagement rates around 1.92%, outperforming single images at 1.74%.