Running Facebook and Instagram ads is no longer just about creative ideas and audience targeting. If you don’t know how to read your data, you’re flying blind. Worse — you may waste your budget on ads that don’t work and miss the opportunity to scale the ones that do.
Yet many advertisers fall into the same trap: they open Ads Manager and immediately feel overwhelmed. Dozens of metrics. Multiple columns. Inconsistent results.
This guide is designed to help advertisers, marketers, and business owners get clarity. You’ll learn how to track Facebook Ads performance without getting lost in the data — and how to focus on the numbers that truly move your campaigns forward.
Why Performance Tracking Is Critical
Data isn’t optional. It’s your competitive edge.
Without proper tracking, you can’t evaluate what’s working — or why something’s failing. Every campaign should be measured against clear objectives and supported by reliable metrics.
When you track your ads correctly, you can:
-
Measure real ROI — Not just how many people clicked, but how many bought or converted;
-
Allocate budget effectively — Shift spending toward high-performing campaigns with lower acquisition costs;
-
Diagnose problems early — Identify weak creatives, underperforming audiences, or tracking errors before they scale;
-
Build repeatable systems — Document what works and apply it across new ad sets, audiences, or offers.
This level of clarity separates the pros from the guessers.
Know the Metrics That Actually Matter
Facebook Ads Manager shows you more than 30 metrics by default. But you don’t need them all — especially not at once.
Some metrics are critical to understanding performance; others are just noise. Start by identifying your campaign goal, then align your metrics accordingly.
Related reading: What Facebook Metrics Actually Predict Conversions.
Key Performance Metrics to Prioritize
These core metrics give you a performance-based view of your ad effectiveness.
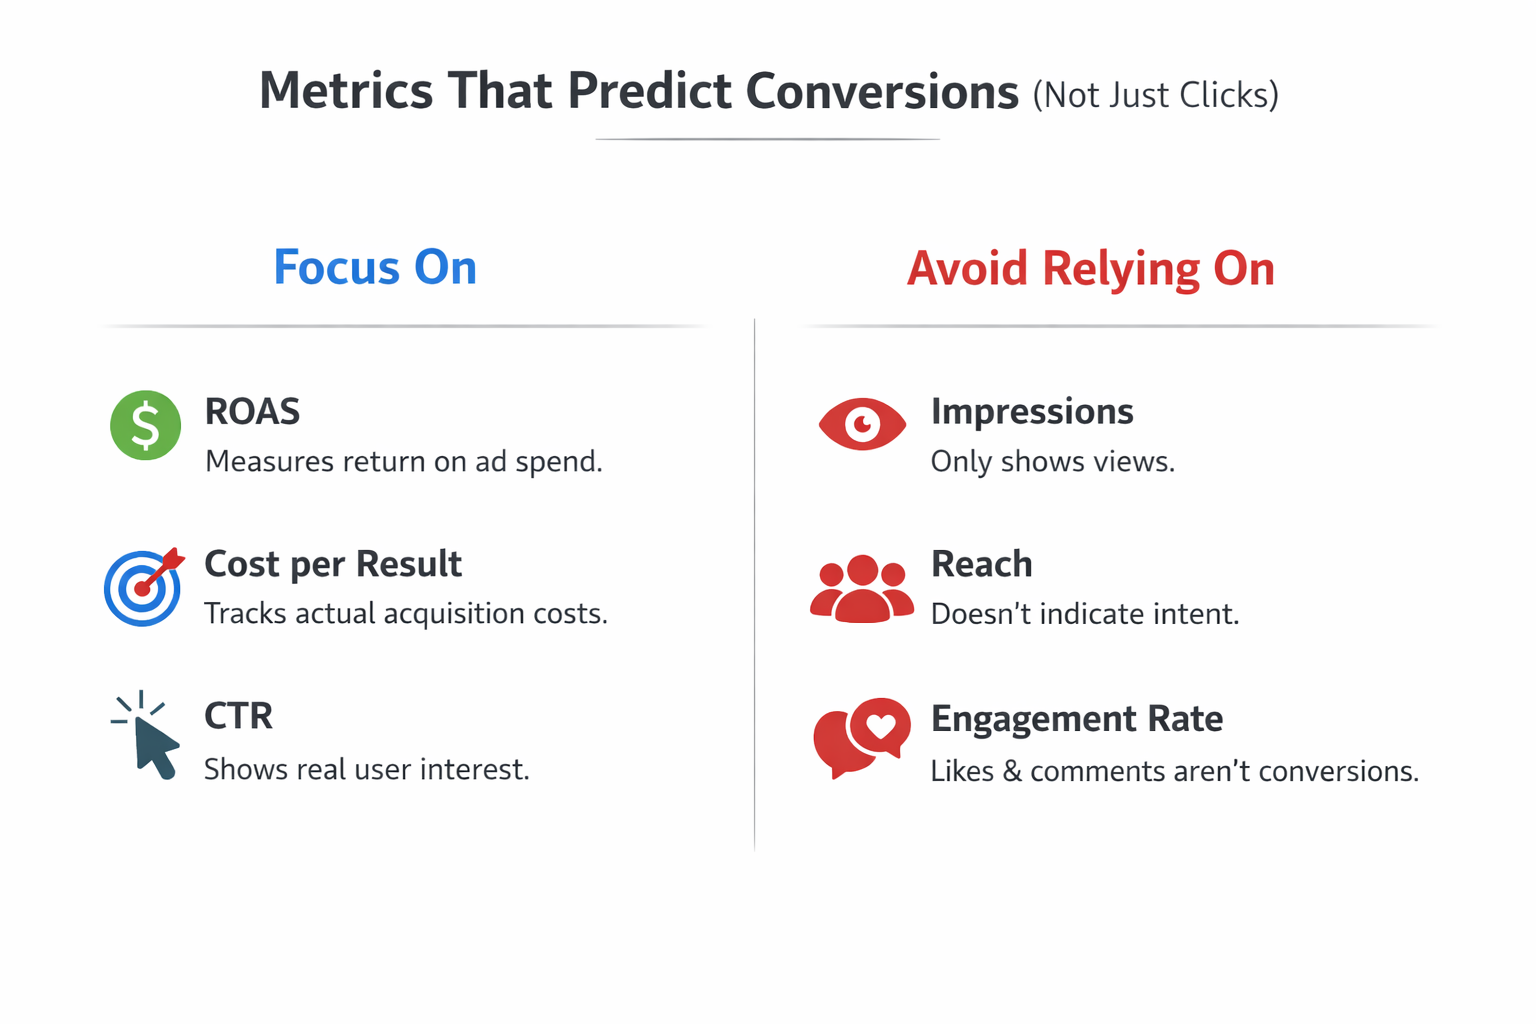
1. Return on Ad Spend (ROAS)
This shows the revenue generated for every dollar spent.
-
A ROAS of 3.0 means you earned $3 for every $1 invested;
-
Use ROAS to track profitability — especially in e-commerce or sales-focused funnels;
-
Compare ROAS across campaigns to see which ones deliver the best value.
2. Cost per Result
This metric tracks how much you’re paying to achieve a specific campaign goal.
-
For lead generation: Cost per lead (CPL);
-
For purchases: Cost per purchase (CPP);
-
Helps determine whether your acquisition costs are sustainable over time.
3. Click-Through Rate (CTR)
This shows the percentage of users who click after seeing your ad.
-
A low CTR may suggest poor creative or mismatched targeting;
-
A high CTR with low conversions could signal landing page issues;
-
Useful for testing headlines, images, and CTA effectiveness.
By focusing on these three metrics, you’ll have a much clearer picture of campaign efficiency.
Supporting Metrics That Add Context
While these metrics aren’t primary KPIs, they help you understand what’s happening behind the scenes.
-
Impressions — Show how many times your ad was served, helpful for reach analysis;
-
Frequency — Indicates how often the same user sees your ad; if it exceeds 2.5, consider creative refresh;
-
Engagement Rate — Measures likes, shares, and comments; useful for brand awareness, less so for direct response.
Use them for analysis — not as indicators of success.
Set Up Accurate Tracking Systems
Even the best strategy will fail if your tracking setup is broken. Too many advertisers launch campaigns without ensuring their data is accurate or complete.
Install the Meta Pixel Correctly
The Meta Pixel is your foundation. It tracks user behavior after they click your ad and visit your site.
To make it effective:
-
Install it on every page, including checkout and thank-you pages;
-
Track standard events like “ViewContent,” “AddToCart,” “Purchase,” and “Lead”;
-
Use the Meta Events Manager to test if events are firing correctly.
A misconfigured Pixel can skew every performance metric you rely on.
Connect the Conversions API (CAPI)
Due to iOS privacy changes and browser limitations, relying on the Pixel alone is no longer enough.
Here’s what CAPI does:
-
Sends event data directly from your server to Meta — bypassing browser restrictions;
-
Improves event matching and attribution reliability;
-
Works alongside the Pixel — not as a replacement — for full data coverage.
Recommended: Meta Ads Attribution: What to Know About Windows, Delays, and Data Accuracy.
Organize Campaigns for Clean, Actionable Reporting
Cluttered campaign structures lead to confusion, duplication, and fragmented data. One of the easiest ways to improve performance tracking is to simplify your ad account.
Use a Clear Naming Convention
Standardize how you name your campaigns, ad sets, and ads. This allows for quick scanning and easier reporting.
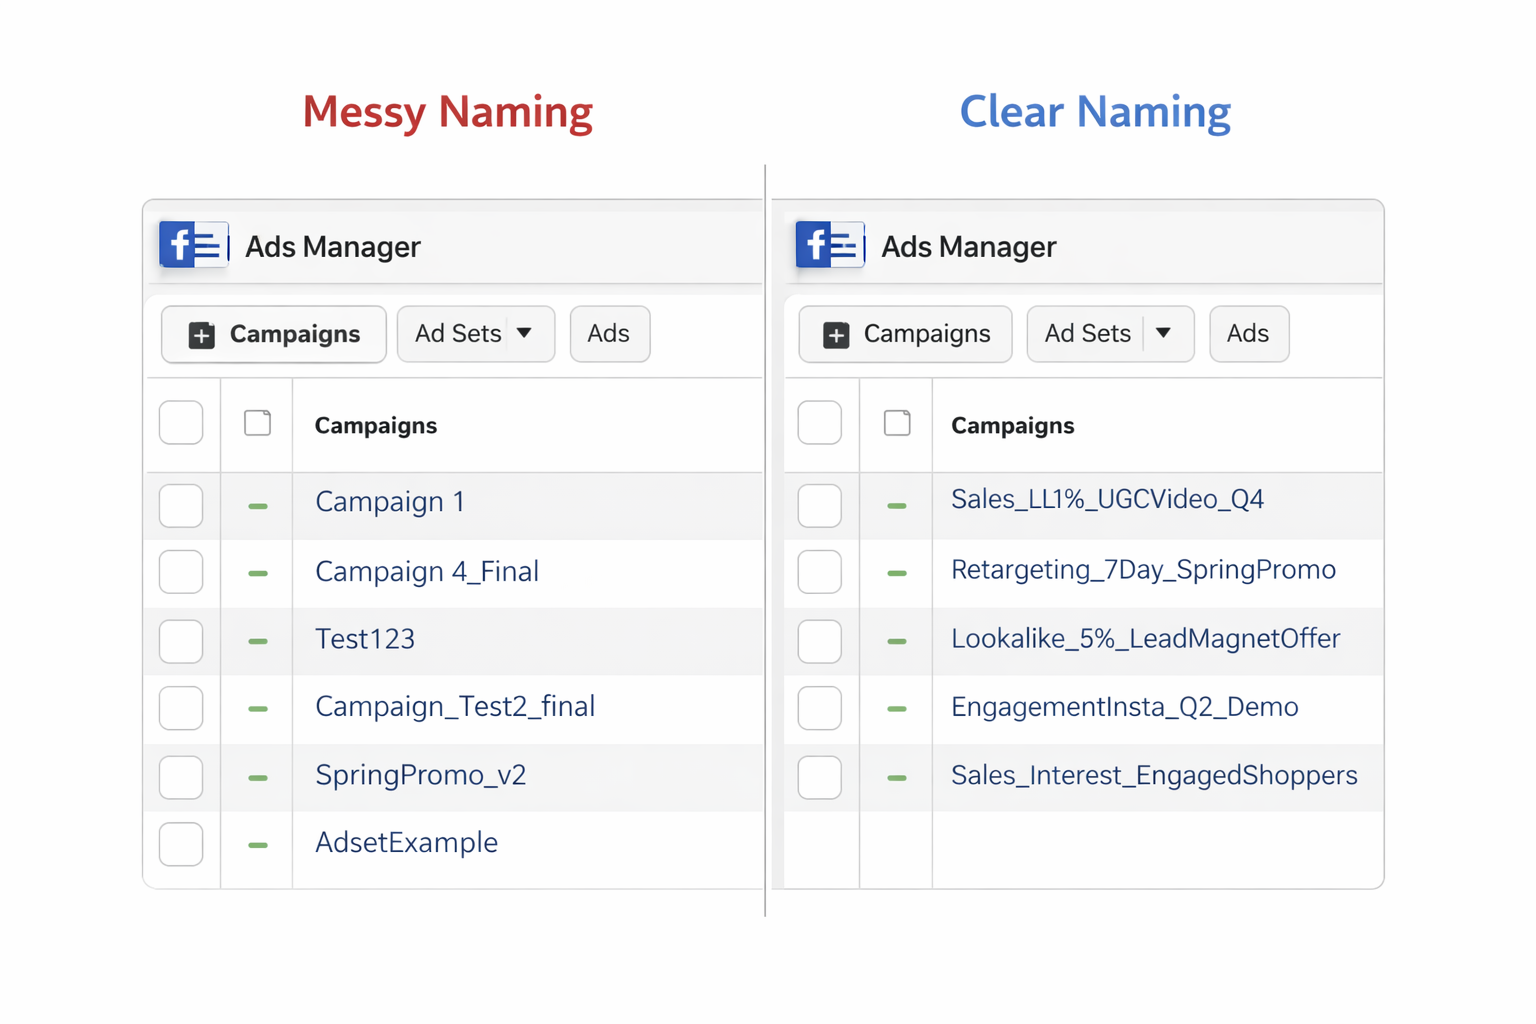
A good campaign name includes:
-
Objective — What you want (e.g., Sales, Leads, Engagement);
-
Audience — Who you’re targeting (e.g., LL1%, Retargeting 30D, Interests_A);
-
Creative — What the format or concept is (e.g., UGC_Video, Static_ImageA).
Example: Sales_LL1%_UGCVideo_Q4
This small habit pays off big when managing multiple campaigns or working in a team.
Consolidate When Possible
Avoid running 10 similar ad sets that split data and slow algorithm learning.
Instead:
-
Group similar audiences into a single ad set for better optimization;
-
Reduce budget fragmentation by running fewer, higher-volume campaigns;
-
Let Meta’s AI learn faster with more data in fewer places.
Simpler structure = cleaner data = smarter decisions.
Customize Your Reporting Views
Meta’s default reporting dashboard isn’t tailored to your specific goals. Build your own custom reports instead.
Adjust Columns Based on Campaign Objective
Depending on your goal, the metrics you monitor should change.
For example:
-
Sales Campaign: ROAS, Purchase Conversion Value, Cost per Purchase;
-
Lead Gen Campaign: Cost per Lead, Landing Page Views, Conversion Rate;
-
Awareness Campaign: Impressions, Frequency, Engagement Rate.
Customize and save different views in Ads Manager for quick reference.
Use Breakdown Filters for Deeper Insights
Breakdowns help you isolate performance by dimension. Use them to analyze:
-
Placement — See if Instagram Stories outperform Facebook Feed;
-
Device Type — Find out if desktop users convert more than mobile;
-
Age, Gender, Location — Useful for refining targeting based on real performance.
These insights reveal areas for optimization you won’t see from top-level metrics.
Watch Trends, Not Just Snapshots
Looking at yesterday’s data won’t tell you much. Campaigns fluctuate naturally, and overreacting can do more harm than good.
Use Weekly Trends and Rolling Averages
Here’s what to do instead:
-
Monitor 7-day averages to smooth out short-term volatility;
-
Compare week-over-week performance to identify real shifts;
-
Evaluate impact 3–5 days after making changes before adjusting again.
See also: Funnel Drop-Off Fixes: How to Improve Each Stage with Facebook Ad Data
This approach keeps you focused on meaningful trends — not noise.
Final Tips to Stay Focused and In Control
The most successful advertisers aren’t tracking more — they’re tracking smarter.
Here’s how to keep it that way:
-
Align metrics with goals. Never track a number just because it’s there;
-
Test one variable at a time. If performance changes, you’ll know what caused it;
-
Document your tests. Record edits, outcomes, and insights to guide future campaigns;
-
Don’t chase vanity metrics. Focus on ROI — not just likes or reach.
Conclusion: Simplify the Process, Amplify the Results
Tracking Facebook and Instagram Ads doesn’t have to feel like data overload. With the right structure, tools, and focus, you can turn performance data into a growth engine.
Start by identifying the right metrics. Set up the Meta Pixel and Conversions API. Build a clean campaign structure. Customize your reports. Track trends over time — not day by day.
With these practices in place, you’ll spend less time sorting numbers and more time scaling what works.
