
Most campaigns don’t fail because the data is missing. They fail because the data isn’t connected to decisions.
You can stare at CTR, CPC, CPA, ROAS, frequency, reach, and conversion rate all day and still not know what to do next—because those metrics are outputs, not a strategy. Strategy is a set of choices backed by evidence:
-
Which audience gets more budget?
-
Which message should lead the next sprint of creatives?
-
What’s the real bottleneck: targeting, offer, landing page, or funnel depth?
-
Are you optimizing for cheap conversions or high-quality customers?
A useful mental model: data doesn’t create strategy—data reduces uncertainty around strategic choices.
Why this matters (with numbers)
Data-to-strategy work has compounding returns because it improves decision quality.
-
A McKinsey survey on customer analytics found that “analytics champions” were 23× more likely to outperform competitors in new-customer acquisition, 9× in loyalty, and ~19× in profitability versus laggards (McKinsey, 2014).
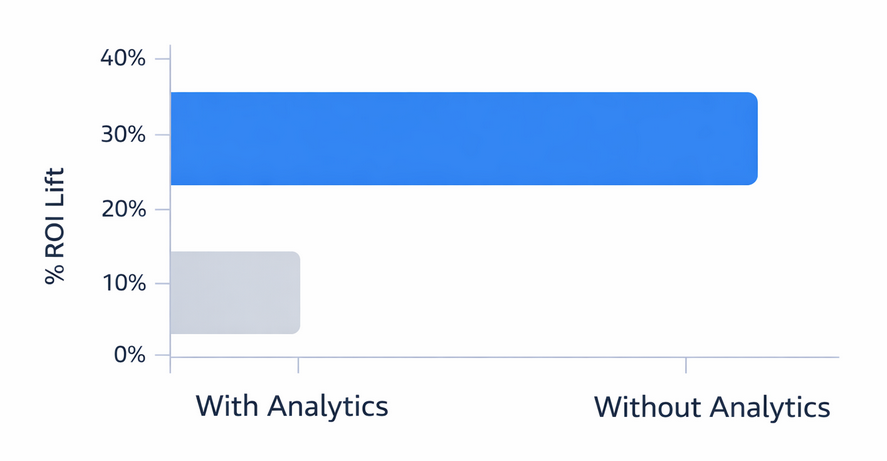
Campaign ROI increases by approximately 31% when analytics inform decision-making
-
In an analysis of 115 A/B tests, the average lift was small (around ~4%), while statistically significant tests averaged about ~6–7% lift—meaning results often come from many small wins, not one giant breakthrough (Analytics Toolkit, 2022).
-
Attribution method can materially change what you believe is working; one multi-touch attribution analysis reported ROAS for a major channel appearing up to ~50% higher compared to last-touch measurement in their modeling (Singular, 2026). Vendor analyses should be sanity-checked, but the point is consistent: measurement choices change decisions.
Step 1: Start with the decision, not the dashboard
Before opening reports, write down the decision you need to make this week. Pick one:
-
Scale: Where can we add spend without breaking efficiency or quality?
-
Fix: What’s the biggest performance bottleneck right now?
-
Refocus: Which segment is most profitable and deserves priority?
-
Test: What hypothesis could unlock the next 5–10% gain?
-
Stop: What should be paused because it’s misleadingly “okay”?
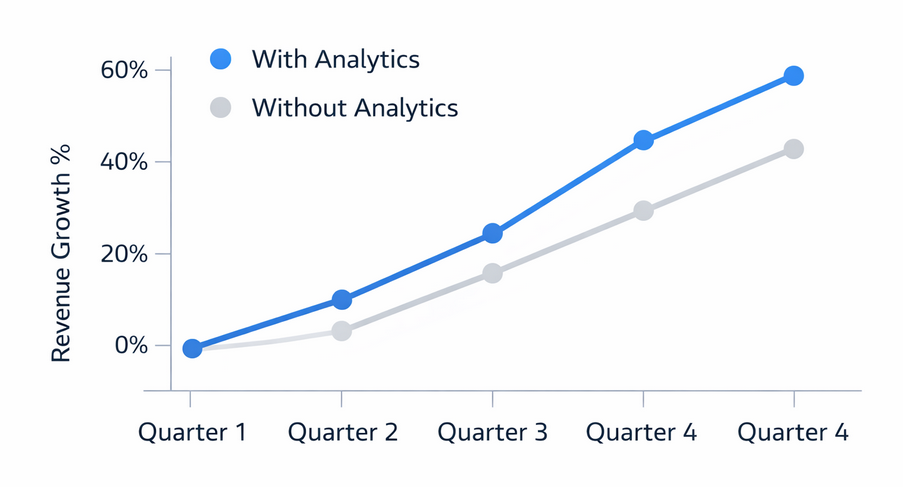
Revenue growth accelerates by roughly 28% over time when analytics are used
If you can’t name the decision, you’ll default to “monitoring,” which feels productive but rarely changes outcomes.
Output of Step 1: a one-sentence decision statement, such as:
“Decide whether to shift 20% of spend from Prospecting A to Prospecting B based on incremental conversions and downstream quality.”
Step 2: Build a metric tree that matches your business goal
A metric tree forces alignment between what you want and what you’re optimizing.
Example metric tree (commerce / lead gen)
-
North Star: Profit or qualified revenue (not just purchases/leads)
-
Volume: conversions, conversion rate, lead volume
-
Efficiency: CPA/CPL, ROAS, cost per qualified lead
-
Quality: refund rate, lead-to-opportunity rate, repeat purchase, AOV/LTV proxy
-
Constraints (guardrails): frequency, complaint rate, landing page speed, margin
-
Two practical rules:
-
Never optimize a top-of-funnel metric without a bottom-of-funnel guardrail. High CTR can coexist with low intent.
-
Separate “fast feedback” metrics from “truth” metrics. Fast feedback helps you iterate quickly; truth metrics tell you whether you’re building a good business.
Output of Step 2: one primary metric + 2–3 guardrails you will not violate.
Step 3: Make your data usable (tracking and naming that enables answers)
Strategy dies when your data can’t answer basic questions like “which creative theme drove high-quality conversions?”
Minimum viable setup:
-
Clean event mapping: view content, lead, add-to-cart, purchase (or equivalent funnel steps)
-
Consistent naming: campaign → objective + audience + offer; ad set → targeting logic; ad → creative concept + angle + format
-
Breakdowns you’ll actually use: placement, device, geo, age bands (only if actionable), time window
If your naming is messy, your “analysis” becomes manual spreadsheet archaeology—and strategy turns into guesswork.
Quick check: If you paused all spend today, could you still explain (in 10 minutes) which message and which audience produced the best customers last week?
Step 4: Convert metrics into diagnoses (what’s happening vs why it’s happening)
Most teams stop at “what.” Strategy requires “why.”
Use a diagnostic ladder:
-
What changed? (trend)
-
Where did it change? (segment)
-
What’s driving it? (mechanism)
-
What should we do next? (decision)
A simple diagnosis grid
When performance moves, sort the cause into one of four buckets:
-
Demand shift: audience intent changed (seasonality, competition, fatigue)
-
Delivery shift: platform delivery moved (learning, audience saturation, placement mix)
-
Message shift: creative no longer resonates (angle fatigue, mismatch, weak hook)
-
Funnel shift: post-click experience changed (page speed, offer clarity, form friction)
This prevents the classic mistake: changing targeting when the landing page is the real problem, or rebuilding creatives when delivery is the issue.
Step 5: Segment like a strategist (find where your results are made)
Overall averages hide the truth. Strategy lives in differences.
Segment your data by:
-
Audience temperature: cold vs warm vs existing customers
-
Creative concept: angle/theme (not just ad ID)
-
Offer type: discount vs bundle vs trial vs lead magnet
-
Placement + format: short video vs static vs carousel, feed vs stories
-
Time: new creatives (days 1–3) vs established (days 7–14+)
-
Frequency bands: 1–2, 3–5, 6–10+ exposures
Then ask: Which segments create efficient volume and hold quality?
That’s where you scale.
Step 6: Turn patterns into hypotheses (not opinions)
A pattern is not a strategy until it becomes a testable hypothesis.
Bad: “Video ads work better.”
Good: “For cold audiences, 10–15s UGC-style videos that open with problem framing produce higher add-to-cart rate without increasing CPA.”
Use this hypothesis template:
-
If we (change X)
-
for (segment Y)
-
then (metric Z improves)
-
because (reason/mechanism)
-
while (guardrail stays within limit)
Output of Step 6: 3–5 hypotheses you can execute this month.
Step 7: Prioritize with expected impact, not urgency
Strategy is choosing what not to do.
Use a lightweight scoring model:
-
Impact: expected lift on the north star (0–3)
-
Confidence: evidence strength (0–3)
-
Effort: design + build + approval time (0–3, reversed)
A quick formula: Priority = (Impact × Confidence) / Effort
This keeps you from over-investing in “interesting” ideas that won’t move the goal.
Step 8: Translate insights into a concrete plan (budget, creative roadmap, experiment backlog)
At this point, you should be able to write a one-page strategy memo:
1) What we believe (based on data)
-
“Warm audiences convert 2× better than cold, but frequency is high and efficiency is slipping.”
-
“Creative theme B drives fewer clicks but higher purchase intent.”
2) What we will do next (actions)
-
Scale: allocate +15% budget to the best-performing segment that meets guardrails
-
Fix: improve landing page speed and above-the-fold clarity before expanding spend
-
Test: launch two new creatives based on the top concept; run a holdout audience test if feasible
-
Stop: pause segments that look good on CTR but fail downstream quality
3) What success looks like (targets)
-
Primary metric target + guardrails for the next 7–14 days
4) What we’ll learn (questions)
-
“Does concept-led creative improve purchase conversion rate in cold audiences without raising CPA?”
That memo is the bridge from data to strategy.
Step 9: Create decision rules so strategy runs faster next time
Decision rules prevent analysis paralysis.
Examples:
-
Scale rule: “Increase budget by 10–20% only when CPA is within target and quality proxy is stable for 3 consecutive days.”
-
Creative rule: “If hook A improves click-to-landing-view but not add-to-cart, rewrite the offer framing.”
-
Fatigue rule: “If frequency > X and conversion rate drops by Y% week-over-week, rotate in new concepts before changing targeting.”
-
Cleanup rule: “If a segment needs constant intervention, it’s not a scalable core.”
You don’t need perfect rules—just consistent ones.
Common mistakes that block strategy
-
Optimizing for what’s easiest to measure, not what matters.
-
Changing multiple variables at once and calling it “learning.”
-
Treating platform attribution as absolute truth instead of a directional signal.
-
Letting “average performance” decide budgets (winners are usually hidden inside segments).
-
Confusing activity with progress (reports without decisions).
A practical weekly workflow (30–60 minutes)
Monday (20 min): Identify the decision + review north star + guardrails
Midweek (20 min): Segment performance; write 2–3 hypotheses
Friday (20 min): Update experiment backlog; pick next week’s tests; document learnings
If you do nothing else, do this: write down what you learned and what you’ll do differently next week. Strategy compounds when learning is captured.