Most B2B campaigns don’t fail because of targeting or creative. They fail because teams track the wrong signals and optimize toward misleading feedback loops.
You can see this clearly in Ads Manager. A campaign reports strong CPL, stable CTR, and acceptable CPM — yet sales teams reject most leads. The system is working exactly as instructed. It’s just optimizing for the wrong outcome.
If you’ve seen campaigns that look efficient in-platform but break down after handoff to sales, the same pattern shows up in What Causes Facebook Lead Ads to Fail (Even When Metrics Look Good).
This article breaks down which KPIs actually reflect pipeline quality, how they behave inside the ad system, and how to use them without distorting delivery.
Why Standard KPIs Create False Confidence
A campaign generating $50 leads often looks efficient on paper. The issue appears only after those leads hit CRM and fail qualification.
This disconnect happens because Meta, like most ad platforms, does not understand business value on its own. It reacts to conversion signals based on volume, consistency, and recency.
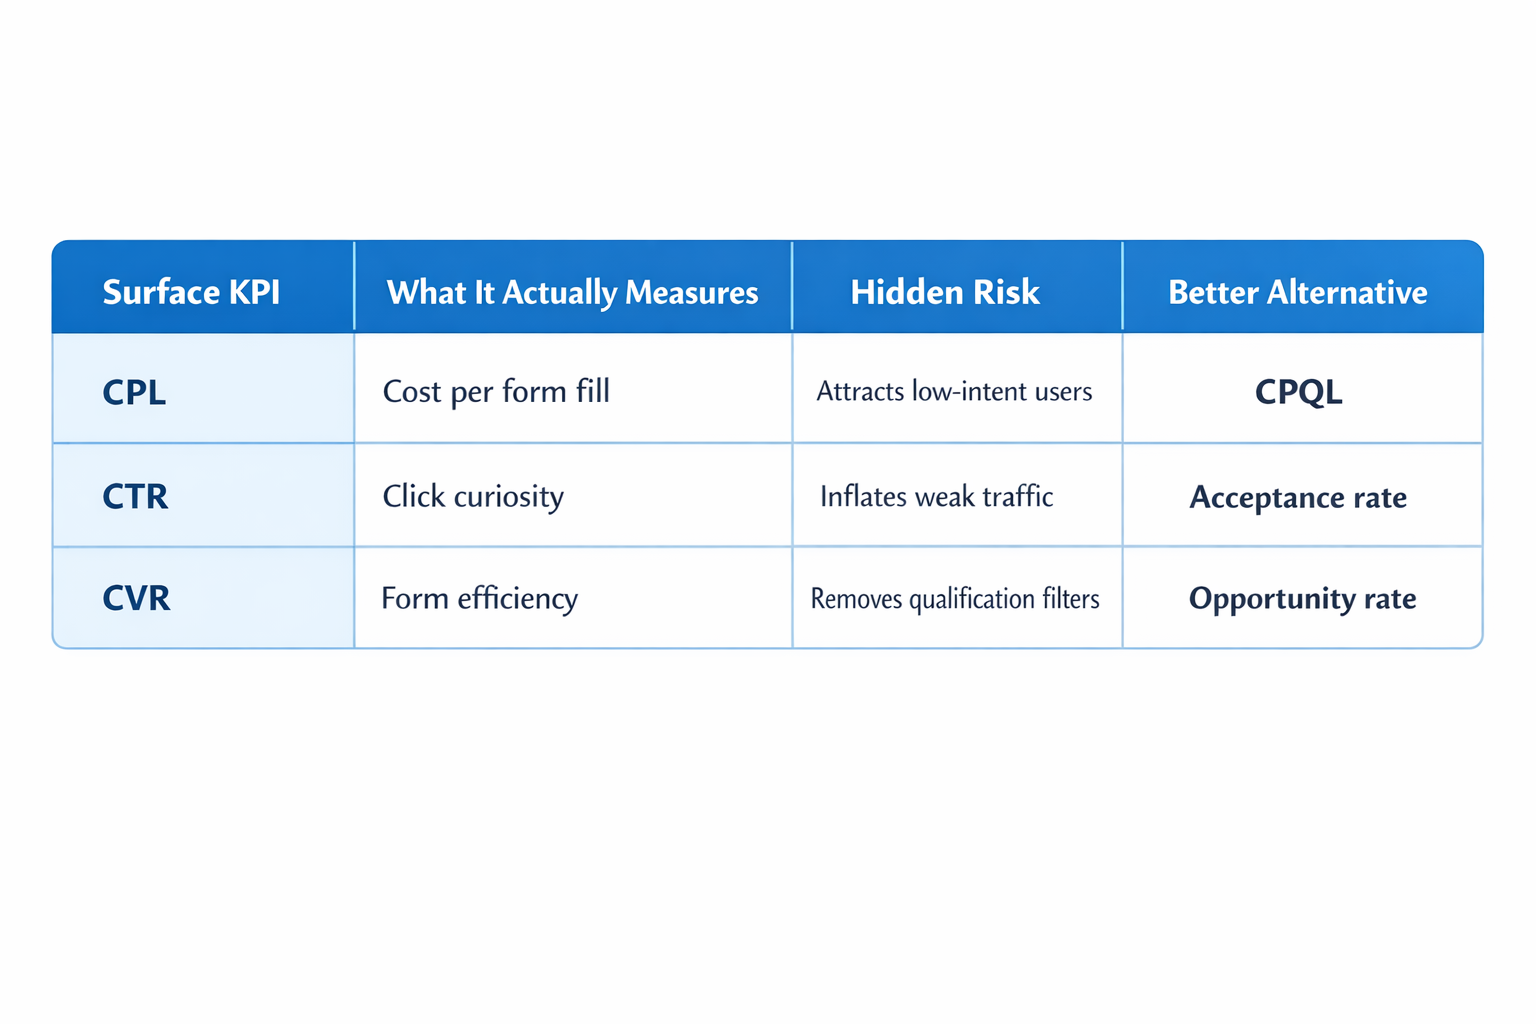
Typical misleading signals:
-
Low CPL.
Cheap leads usually come from broad, low-friction audiences where users convert without showing much real intent. In campaign delivery, this often appears as rising frequency, acceptable click costs, and steady lead volume even while downstream qualification rates start to weaken. -
High CTR.
CTR measures initial reaction, not commercial fit. A strong hook, a curiosity-driven angle, or a broad pain point can raise CTR without improving the quality of users entering the funnel. That’s exactly why CTR vs Conversions: Why High CTR Doesn’t Always Mean More Sales is so relevant to B2B lead generation. -
High conversion rate (CVR).
CVR often improves when forms get shorter, landing pages get simpler, or qualification friction gets removed. The number looks better, but the system starts attracting users who are easier to convert rather than users who are more likely to buy.
The platform is not malfunctioning. It is reinforcing the signal you provide.
The KPI Shift: From Lead Volume to Signal Quality
Once CRM feedback is introduced, performance usually starts behaving differently.
Campaigns often become more expensive at the surface level — CPL rises and lead volume drops — but sales efficiency improves. That is not a contradiction. It is usually the first sign that the system is finally moving toward commercially useful users instead of easy form fills.
The shift happens across three layers:
-
Input signal quality increases.
Instead of training on every submitted lead, the system starts learning from users who passed qualification, were accepted by sales, or moved into pipeline. That changes the behavioral profile the algorithm uses for future delivery. -
Audience expansion becomes more selective.
Lookalikes and modeled audiences start drifting away from shallow engagement patterns and toward stronger intent signals, such as content depth, return visits, or conversion paths that correlate with better downstream outcomes. -
Auction participation changes.
The algorithm often pays more to compete for a narrower set of users. CPM may rise, but the added cost can be justified if those impressions produce materially better pipeline outcomes.
If those structural changes are not visible in your KPI set, you are still measuring volume, not business value.
KPI Layer 1: Cost per Qualified Lead (CPQL)
CPQL is where most B2B teams should begin. It is usually the first metric that separates marketing activity from sales relevance.
The practical problem is timing. Qualification does not happen instantly, so CPQL is always a delayed metric to some degree.
What to monitor:
-
Lag between lead creation and qualification.
If qualification happens within the same day, CPQL can inform near-daily decisions. If the lag is longer, daily readings become noisy and misleading, so it is better to evaluate the metric over a rolling three- to seven-day window. -
Consistency of qualified lead volume.
The system learns better from a steady stream of qualified outcomes than from random bursts. If qualified leads appear in clusters and disappear for long stretches, optimization becomes unstable and delivery patterns often get erratic. -
Lead-to-qualified ratio.
This is one of the clearest health checks in B2B lead gen. When that ratio shifts suddenly, it usually points to one of three issues: targeting drift, a weaker offer-to-audience match, or creative that is attracting the wrong type of user.
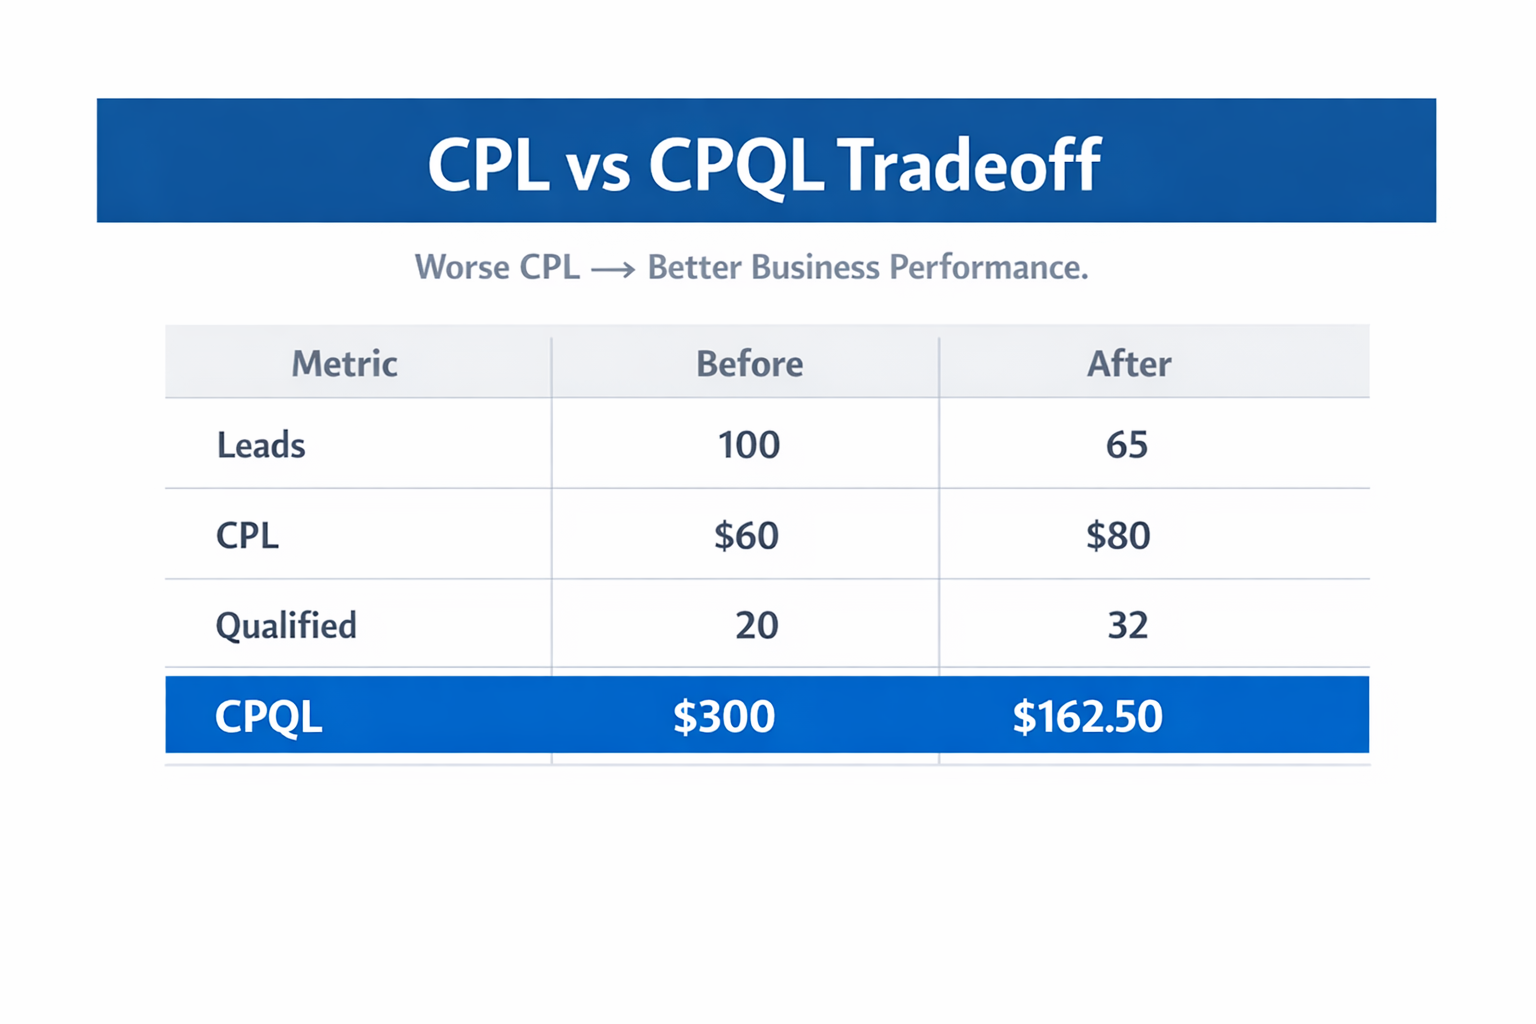
Operational example:
- A campaign generates 100 leads per week at $60 CPL.
Only 20 qualify, so CPQL is $300.
After tightening targeting and adjusting the offer:
- The campaign generates 65 leads per week at $80 CPL.
But 32 qualify, so CPQL drops to $162.50.
Top-level efficiency appears worse. Actual performance improves.
KPI Layer 2: Sales Acceptance Rate
Sales acceptance rate is one of the most underused KPIs in paid acquisition.
It answers a simple but important question: do sales teams believe these leads are worth working?
That matters because marketing can keep producing leads long after sales has already decided the pipeline is low quality. When that gap appears, reporting often stays positive for too long.
What to track:
-
Acceptance rate by campaign.
Different campaigns may generate similar CPL while producing very different levels of sales trust. This is common when one campaign is optimized for ease of conversion and another is optimized for relevance. -
Acceptance rate by audience type.
Broad, cold, and lightly filtered audiences often behave very differently from CRM-based, retargeting, or high-intent seed audiences. Looking only at account-level averages hides that difference. -
Acceptance rate trend over time.
A slow decline in acceptance rate usually shows up before you see serious damage in opportunity creation or revenue metrics. That makes it a useful early warning signal.
If acceptance rate drops while CPL improves, the campaign is usually moving in the wrong direction.
KPI Layer 3: Cost per Opportunity
This is where paid acquisition starts connecting more directly to pipeline creation.
An opportunity is not just a lead that looked acceptable at first glance. It is a lead that moved far enough through qualification and sales review to justify real pipeline attention.
At this stage, the data usually becomes thinner and more volatile.
What to monitor:
-
Qualified-to-opportunity conversion rate.
If qualified leads are not turning into opportunities, the issue often sits between expectation and reality. That can mean the ad promise is too broad, the landing page frames the offer incorrectly, or sales qualification is not aligned with campaign positioning. -
Time-to-opportunity.
The longer it takes for leads to become opportunities, the weaker the feedback loop becomes for media optimization. In those cases, CPQL or acceptance rate often needs to serve as the operational KPI while opportunity data is used at a slower review cadence. -
Campaign-level variance.
Some campaigns produce fewer leads but more serious pipeline. Those campaigns often look weaker in top-line dashboards and stronger in business reality.
This is also where the logic behind Audience Quality vs Quantity: What Drives Better Long-Term Results? becomes operational rather than theoretical.
KPI Layer 4: Revenue per Lead (RPL)
Revenue per Lead changes the conversation completely.
Once you start measuring RPL, lead generation stops being a volume exercise and becomes a value exercise. Two campaigns can produce the same CPL and the same number of leads while generating very different revenue outcomes.
How to use it:
-
Break it out by campaign, audience, and entry point.
Revenue concentration is rarely uniform. Certain audiences or creative angles may produce a smaller share of total leads while generating a much larger share of actual revenue. -
Watch distribution, not just the average.
Average RPL can be distorted by a few unusually large deals. To interpret the metric correctly, you need to look at spread, outliers, and consistency, not just the mean. -
Read it together with volume.
A campaign with very high RPL and almost no lead volume may be strategically useful, but not scalable enough to carry the program. RPL should guide budget decisions, but not in isolation.
Diagnostic signal:
If lead volume grows while RPL declines, the campaign is probably expanding into weaker segments.
KPI Layer 5: Customer Acquisition Cost (CAC)
CAC is the most complete business KPI in the system, but it is usually too delayed to manage campaigns day by day.
That does not make it less important. It just means CAC is better for strategic review than daily optimization.
What CAC reveals:
-
How efficiently each channel creates customers over time.
One campaign may win on lead cost and lose on actual customer cost because the lead quality is weaker once it enters the pipeline. -
Where scaling starts to break.
As budgets rise, CAC often increases before teams realize the account has moved beyond efficient inventory. -
Whether upstream signals were actually meaningful.
If CPL, CTR, and lead volume looked strong but CAC deteriorates over time, the account was likely scaling on low-value conversion signals.
Operational use:
-
Review CAC over a longer period, usually 30 to 90 days depending on sales cycle length.
-
Compare it across campaigns, not just across channels.
-
Use it to guide budget allocation and strategic direction, not quick tactical edits.
How These KPIs Interact in Practice
Looking at any one of these KPIs alone creates blind spots.
A campaign may show:
-
improving CPL;
-
stable CTR; and
-
growing lead volume.
At the same time, it may also show:
-
declining sales acceptance;
-
rising CPQL; and
-
falling RPL.
That pattern usually means the account is scaling the wrong kind of demand.
A healthier pattern often looks less attractive at first glance:
-
CPL rises moderately;
-
lead volume decreases slightly;
-
sales acceptance improves;
-
CPQL declines; and
-
RPL increases.
This is the point where optimization starts serving the business instead of the dashboard.
Common KPI Mistakes in B2B Campaigns
1. Optimizing too early for downstream metrics
Teams often try to optimize for opportunities or revenue before they have enough data density.
Why this backfires:
-
The platform does not receive enough consistent conversion volume to learn stable patterns.
-
Delivery becomes slower and more erratic because the optimization target is too sparse.
-
Teams mistake low delivery for platform weakness, when the real issue is signal scarcity.
What to do instead:
Start with a higher-volume signal such as leads or qualified leads. Then move downstream only when the account has enough stable conversion flow to support it.
2. Ignoring signal consistency
High-quality events matter, but consistency matters too.
Common pattern:
-
A campaign produces excellent leads on some days and almost none on others.
-
Sales outcomes look promising in snapshots but unstable over longer periods.
-
The account struggles to leave learning or maintain predictable spend distribution.
What to do instead:
Use qualification criteria that are strong enough to preserve relevance, but not so narrow that the signal disappears. A weaker but consistent signal often outperforms a stronger but sporadic one.
3. Treating all leads as equal
This is one of the biggest reporting mistakes in B2B lead gen.
Why it matters:
-
Different campaigns attract different buyer profiles.
-
Different forms, offers, or entry pages create different qualification patterns.
-
Aggregated dashboards flatten those differences and hide the real source of quality.
What to do instead:
Break performance down by campaign, audience, offer, and creative entry point. That is often where the real leverage sits.
4. Overvaluing platform-reported metrics
Platform metrics are useful, but they are not the whole system.
The recurring problem is simple: the platform reports what it can observe quickly. Your business cares about what happens later.
That’s why it helps to pair this article with How to Analyze Facebook Ad Performance Beyond CTR and CPC, which addresses the same measurement gap from a broader campaign-analysis perspective.
What to do instead:
Validate in-platform performance against CRM progression, opportunity creation, and revenue contribution on a regular schedule.
A Practical KPI Framework for B2B Campaigns
Instead of trying to track everything at once, structure KPIs by decision speed.
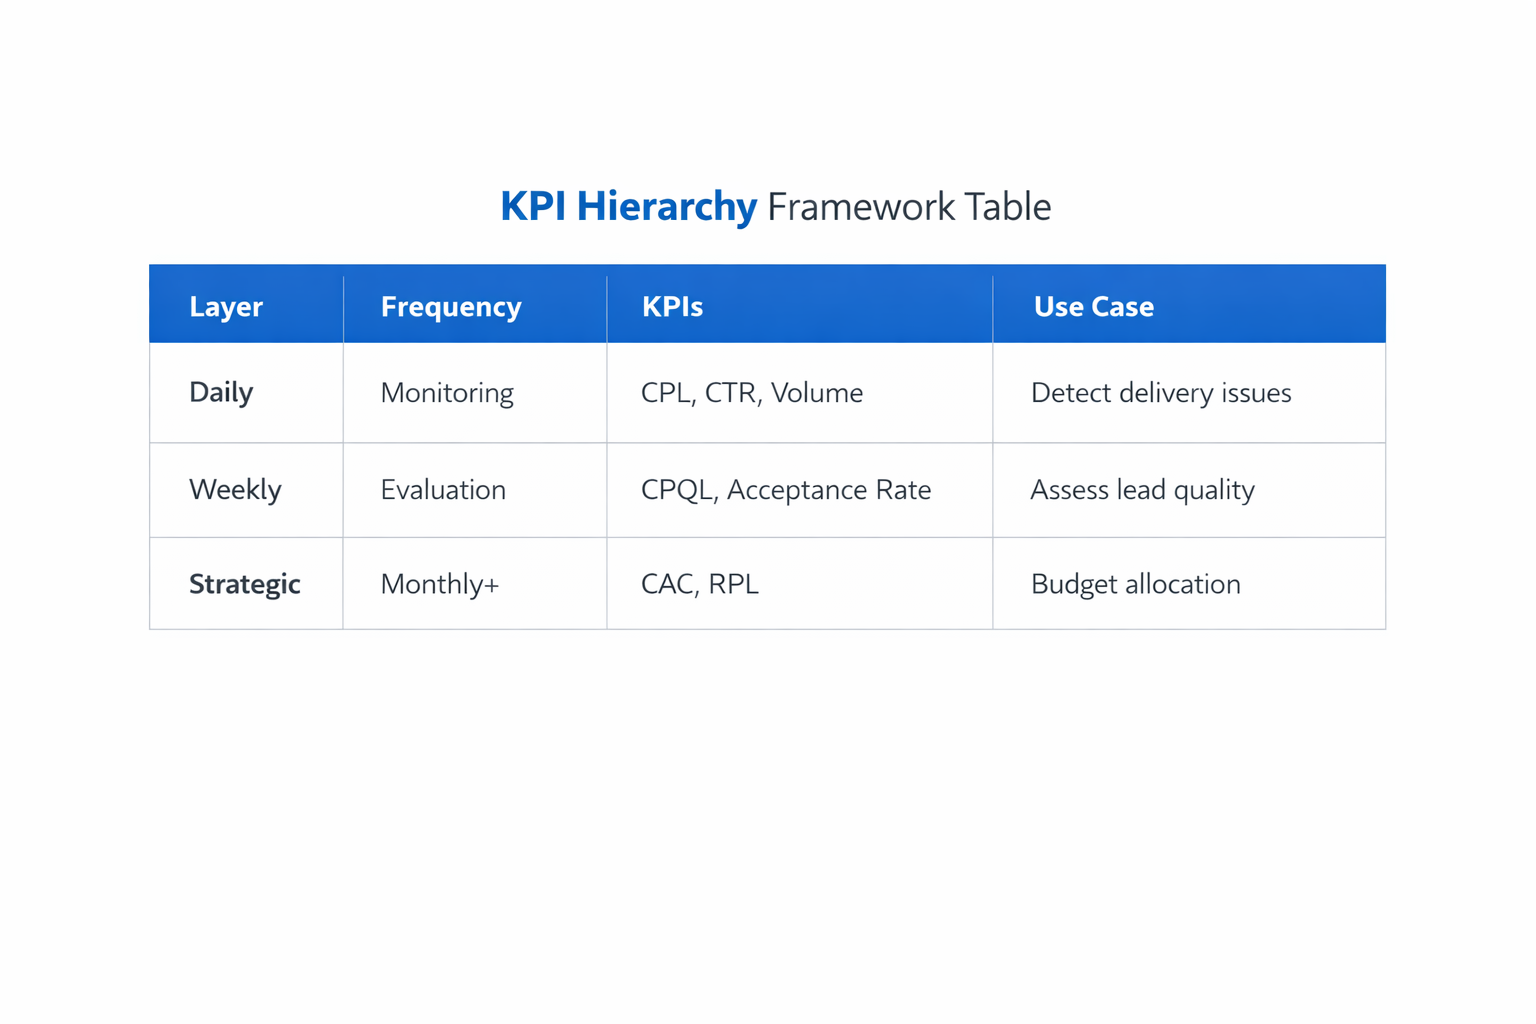
Top-level metrics for daily monitoring:
-
CPL, which helps detect delivery shifts, cost spikes, and budget pacing problems before they spread.
-
Lead volume, which shows whether the campaign is still generating enough conversion activity to support stable learning.
-
CTR, which is useful for creative diagnosis, but only when interpreted as an attention signal rather than a quality signal.
Mid-level metrics for weekly evaluation:
-
CPQL, which shows whether the campaign is producing leads sales can realistically use.
-
Sales acceptance rate, which reveals whether marketing output still matches what sales wants to work.
-
Qualification rate, which helps identify targeting drift, offer mismatch, or lead-form quality issues before pipeline metrics deteriorate further.
Bottom-level metrics for strategic review:
-
Cost per opportunity, which connects paid acquisition to real pipeline entry.
-
Revenue per Lead, which identifies where actual commercial value is concentrated.
-
CAC, which shows whether the acquisition system is creating customers efficiently over a full sales cycle.
Each layer answers a different question. Mixing them into one dashboard without role separation usually creates confusion instead of clarity.
Final Takeaway
The ad platform does not optimize for revenue unless you feed it signals that are structurally closer to revenue.
If your KPI stack stops at lead volume, the system will keep finding more leads — even when those leads do not convert into pipeline or customers.
Once you introduce qualification, sales acceptance, opportunity creation, and revenue-based measurement, campaign behavior usually changes. Volume often falls first. Efficiency improves after.
That shift is not a problem. It is usually the first sign that your reporting has stopped rewarding the wrong outcome.