
Meta campaigns can generate hundreds of leads per week. Sales teams often call them in the wrong order. That gap wastes budget and damages trust between marketing and sales.
Lead scoring fixes that problem when it reflects real buying intent. Most scoring models fail because they track activity, not readiness. The result is friction, slow follow-up, and missed revenue.
This guide explains how to design scoring models that actually improve sales alignment.
Why Lead Scoring Fails in Meta Campaigns
Many advertisers treat every lead form submission as equal. That assumption ignores context, source quality, and user behavior. Sales teams then complain about bad leads, while marketing defends volume metrics.
Three common issues create this tension:
-
Volume-driven optimization; campaigns optimize for lowest cost per lead, not revenue contribution. For example, a broad lead form campaign generates 400 contacts, but only five match the ideal profile.
-
Shallow scoring logic; models rely only on job title or company size. A manager at a large company scores high, even though they have no buying authority.
-
No feedback loop; sales outcomes never return to marketing systems. Closed-lost leads still receive high scores months later.
If your campaigns already struggle with poor-quality submissions, review why most Facebook lead generation campaigns fail and how to fix yours . Weak lead quality at the source makes scoring harder.
When scoring ignores sales outcomes, alignment breaks. Marketing reports efficiency. Sales reports frustration.
What Sales Actually Needs From a Scoring Model
Sales teams do not need more data. They need prioritization clarity. The model must answer one question: who should we call first?
A useful scoring model should:
-
Rank leads by probability of meaningful conversation; not just form completion. For instance, a demo request from a returning visitor should outrank a cold eBook download.
-
Reflect urgency signals; demo requests are not equal to content downloads. A pricing inquiry often signals active evaluation.
-
Adjust dynamically; yesterday’s scoring assumptions may not hold today. If retargeting leads close faster this quarter, weights must shift.
If your team struggles to separate high-value contacts from noise, explore how to spot low-quality leads before they hurt your funnel . Early filtering improves scoring precision.
If your model cannot explain why a lead scores 87 instead of 42, sales will ignore it.
Core Components of an Effective Lead Scoring Model
A strong model blends demographic fit, behavioral intent, and campaign context. Each component carries a specific weight.
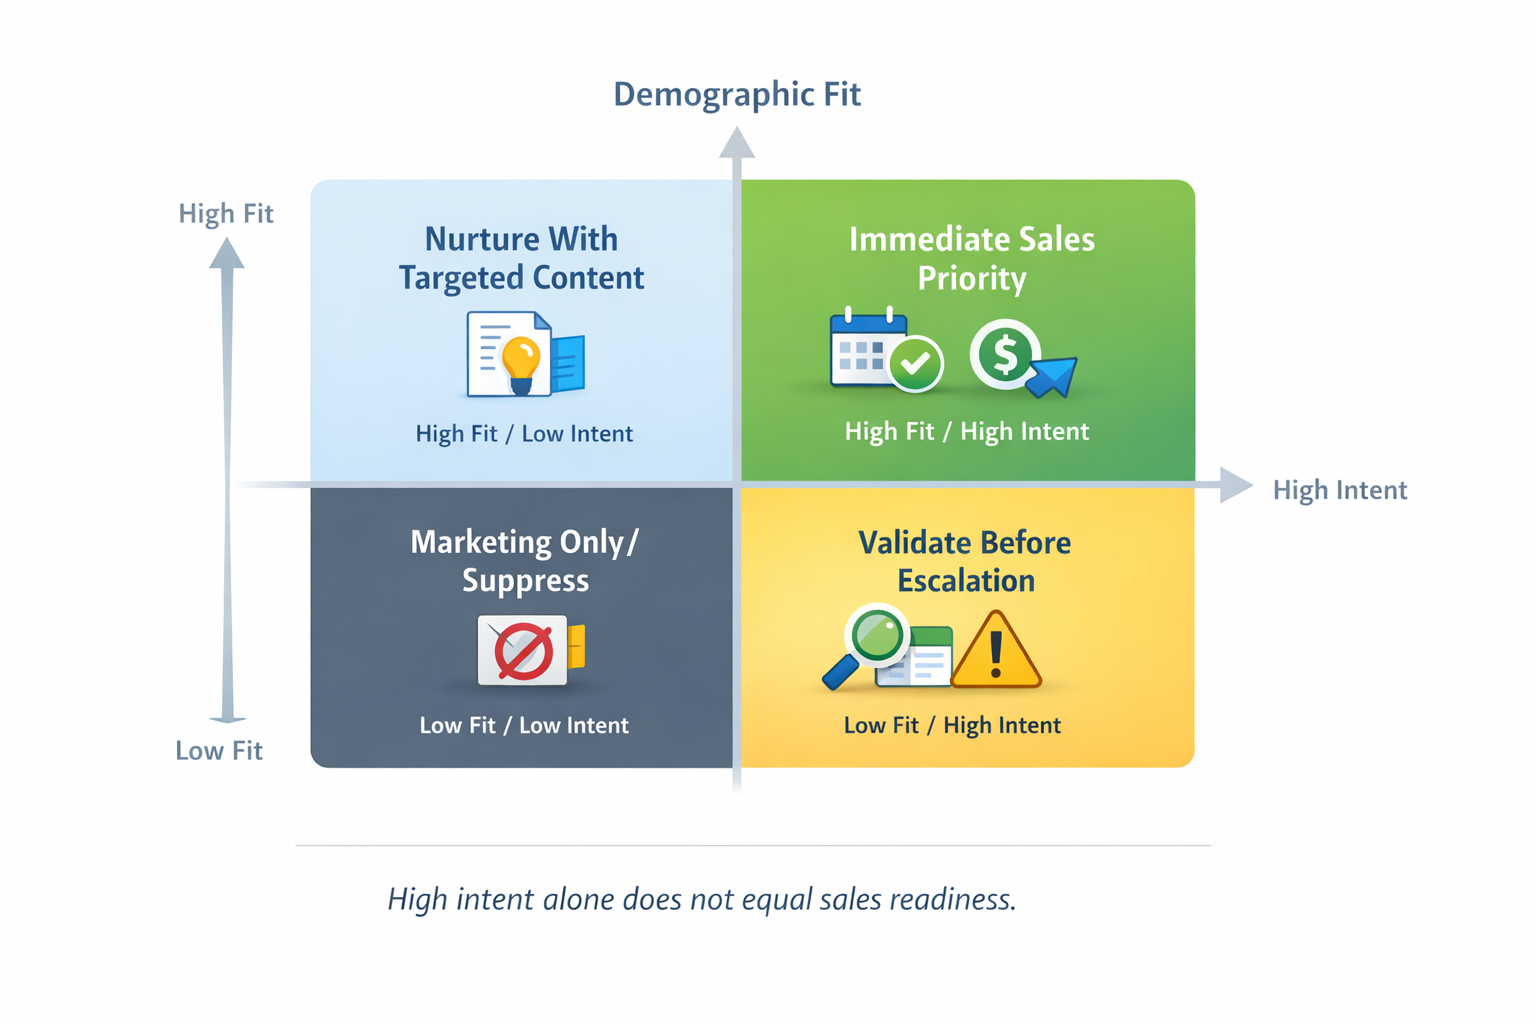
Demographic and Firmographic Fit
Fit scoring defines whether the lead matches your ideal customer profile. It answers who the lead is.
Common inputs include:
-
Job role; decision-makers score higher than junior staff. A VP of Marketing receives 20 points, while a marketing intern receives zero.
-
Company size; enterprise offers differ from SMB packages. A company with 200 employees may align better with your pricing model.
-
Industry; some verticals convert faster than others. If SaaS companies close at twice the rate of retail, weight accordingly.
-
Geography; service availability matters. A lead outside your supported region should receive minimal or negative points.
Imagine two leads submit the same demo form. One works at a funded SaaS firm with 150 employees. The other is a freelancer. Fit scoring separates them immediately.
Behavioral Intent Signals
Intent scoring measures what the lead does. This is where Meta campaign data becomes critical.
Key behavioral inputs include:
-
Form type; demo request, pricing inquiry, or gated report. A demo request might receive 30 points, while a checklist download receives five.
-
Ad engagement depth; video watch percentage or multiple ad clicks. A user who watches 75 percent of a product video shows stronger interest.
-
Website activity; pricing page visits, return sessions, time on site. Two visits to the pricing page in one week suggest evaluation.
-
Speed to submit; fast submissions often signal high motivation. A user who clicks and submits within minutes likely came with intent.
Consider a hypothetical case. A lead clicks a retargeting ad, visits the pricing page twice, and requests a demo within three days. That behavioral pattern should push the score above your SQL threshold.
Campaign Context and Source Quality
Not all Meta campaigns produce equal lead quality. Audience and objective matter.
Consider:
-
Campaign objective; lead generation versus traffic campaigns. Objective choice shapes downstream lead quality. Review how Facebook ad objectives impact lead quality before assigning equal weight to all sources.
-
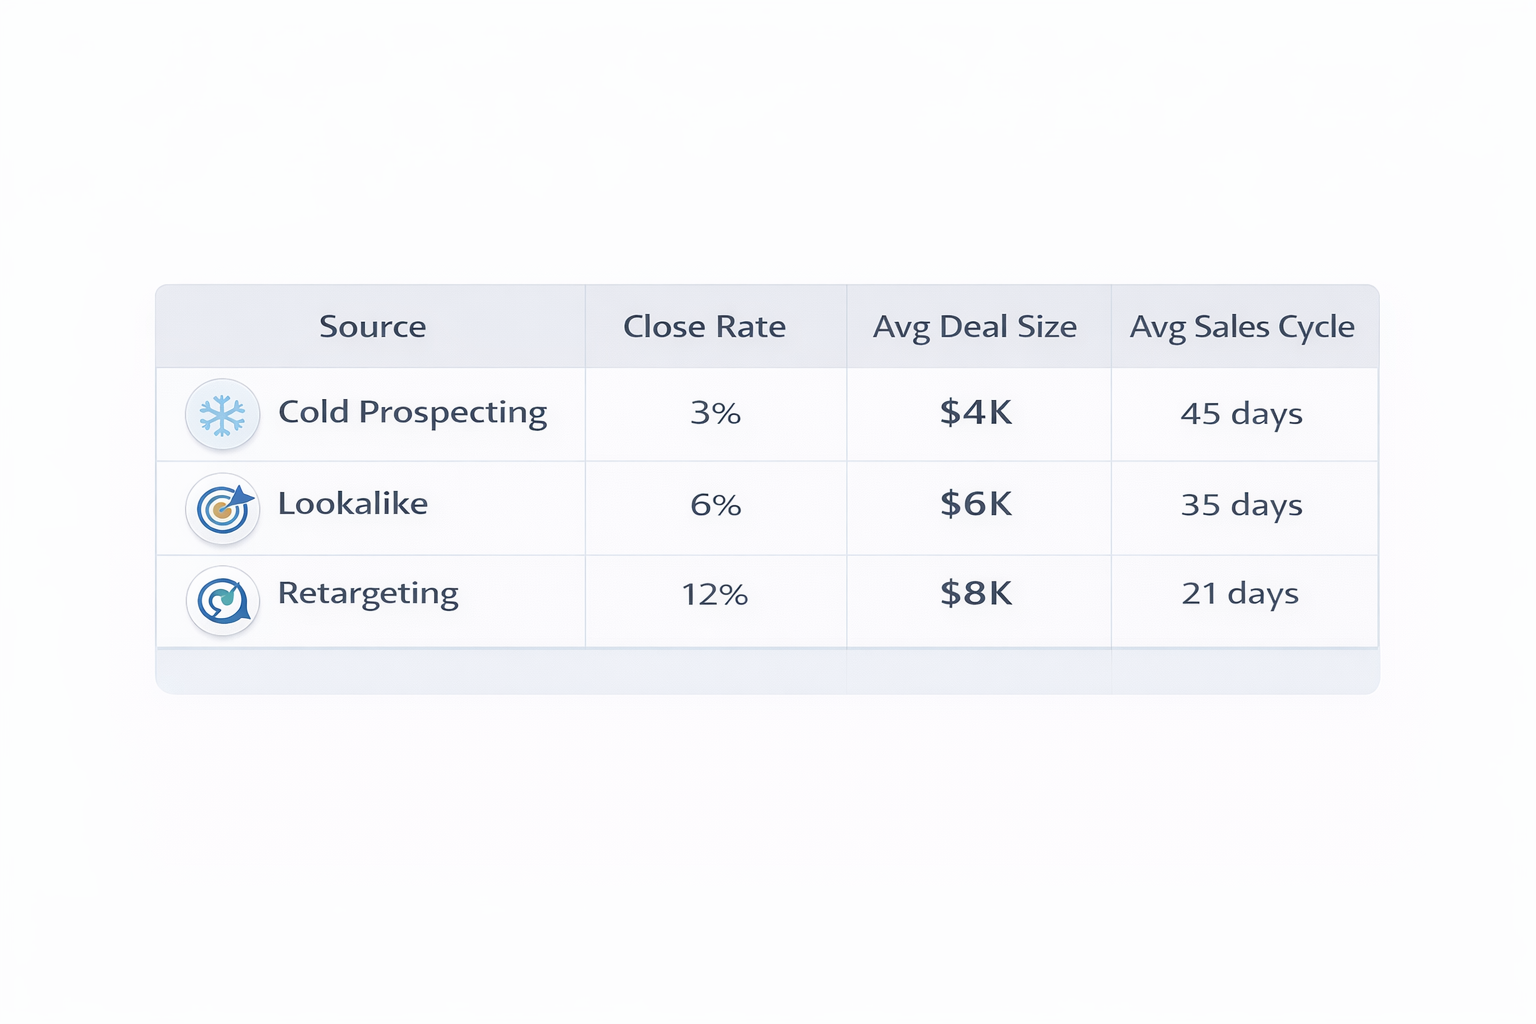
Audience temperature; cold prospecting versus retargeting. Retargeting audiences frequently show higher close rates.
-
Creative angle; problem-focused ads attract different intent than value-focused ads. A cost-reduction message may pull budget-conscious buyers.
-
Placement; some placements produce accidental clicks. Certain mobile placements may inflate low-quality leads.
Example scenario: cold prospecting leads close at 3 percent, while retargeting leads close at 12 percent. Your scoring model should reflect that gap with meaningful weight differences.
Building a Weighted Scoring Framework
A weighted model is more transparent than a black-box system. Sales teams trust models they understand.
Step 1: Analyze Closed-Won and Closed-Lost Data
Start with historical CRM data. Compare closed-won leads against closed-lost leads across key variables.
Look for patterns such as:
-
Higher close rates from specific industries. For example, fintech leads may convert twice as often as ecommerce leads.
-
Faster deal cycles from certain form types. Demo requests may move to opportunity within ten days.
-
Stronger conversion from retargeting audiences. These leads may require fewer follow-ups.
Translate those patterns into numeric weights. Avoid equal weighting across categories.
Step 2: Assign Point Values Based on Revenue Impact
Every scoring variable must connect to revenue probability. Use conversion rates to guide points.
| Signal | Category | Points | Weighted Impact | Notes |
|---|---|---|---|---|
| Demo Request | Behavioral | 30 | High | Strong buying signal |
| Pricing Page Visit | Behavioral | 20 | Medium-High | Evaluation stage |
| Decision-Maker Title | Fit | 15 | Medium | Authority |
| Retargeting Source | Context | 10 | Medium | Warmer audience |
| Personal Email | Negative | -15 | Risk | Lower B2B likelihood |
Example framework:
-
Demo request; 30 points.
-
Pricing page visit; 20 points.
-
Decision-maker title; 15 points.
-
Retargeting source; 10 points.
-
General content download; 5 points.
Imagine Lead A scores 75 points through high-intent actions and strong fit. Lead B scores 35 from a checklist download and weak fit. Sales should contact Lead A within hours, not days.
Step 3: Define Clear MQL and SQL Thresholds
Alignment improves when thresholds are explicit. Ambiguity creates conflict.
Set:
-
Marketing Qualified Lead threshold; for example, 40 points.
-
Sales Qualified Lead threshold; for example, 65 points.
-
Disqualification triggers; such as student or competitor email domains.
In practice, if a lead crosses 65 points after a demo request and pricing visit, the CRM should route it directly to a senior rep.
If you want a deeper framework for structuring this handoff, review how to use Facebook ads to fill a sales pipeline, not just a form . Scoring must support pipeline velocity, not vanity metrics.
Integrating Meta Signals Into Your CRM
Meta provides valuable engagement data. Many teams fail to use it.
To improve scoring accuracy:
-
Sync custom conversions into your CRM; include ad engagement metrics.
-
Track lead source at the ad set level; not just campaign level.
-
Pass UTM parameters into lead records; enable deeper attribution analysis.
-
Use offline conversion uploads; connect revenue back to specific audiences.
For example, if a specific lookalike audience produces higher average deal size, your scoring model can assign additional weight to that source.
Advanced Scoring Techniques for Better Alignment
Basic point systems help, but advanced adjustments create stronger alignment.
Time Decay Scoring
Intent fades over time. A lead who visited pricing yesterday differs from one who visited three weeks ago.
Apply time decay by:
-
Reducing behavioral points after set periods. Remove ten points if no activity occurs within 14 days.
-
Increasing urgency for recent high-intent actions. Trigger immediate alerts for demo requests within 24 hours.
-
Triggering automated sales alerts for rapid activity bursts. Three visits in one day may justify escalation.
This keeps sales focused on fresh opportunities.
Negative Scoring
Not all actions are positive signals. Some behaviors predict low conversion.
Apply negative points for:
-
Personal email domains in B2B campaigns; subtract 15 points.
-
Multiple low-intent downloads without high-intent actions; subtract five points after repeated patterns.
-
Mismatched geography or unsupported industries; assign strong negative values.
-
Long inactivity after initial submission; gradually reduce total score.
Imagine a lead downloads four guides over two months but never visits pricing. Negative scoring prevents false prioritization.
Revenue-Based Scoring Feedback Loops
Closed revenue should influence scoring weights. Many teams stop at opportunity stage.
Improve alignment by:
-
Assigning higher weight to sources with larger deal sizes. If webinar leads produce higher contract value, adjust upward.
-
Adjusting scores when average contract value shifts. If enterprise deals grow, emphasize firmographic weight.
-
Running quarterly scoring audits tied to revenue metrics. Compare score distribution against actual closed-won rates.
In one scenario, marketing reduced weight on content downloads after discovering they rarely led to revenue. Sales response time improved within weeks.
Aligning Sales Processes With Scoring Output
Even strong models fail without process alignment. Scoring must connect to workflow.
Ensure:
-
Leads above SQL threshold route directly to senior reps; response time should stay under 24 hours.
-
MQL leads enter structured nurture sequences before handoff; educate before sales contact.
-
Low-score leads stay in marketing automation until re-engagement; avoid premature outreach.
-
Sales feedback updates lead status consistently; refine scoring assumptions over time.
Weekly review meetings between marketing and sales reduce misinterpretation. Use score distribution and close rates as shared reference points.
Common Mistakes to Avoid
Several pitfalls undermine alignment.
-
Overcomplicating the model; too many variables reduce clarity and trust.
-
Ignoring campaign-level differences; not all Meta traffic behaves equally.
-
Failing to retrain the model; markets change and buyer behavior shifts.
-
Measuring scoring success by volume; measure by opportunity and revenue impact.
Lead scoring is not a static project. It is an operational system that requires ongoing calibration.
Final Thoughts
Lead scoring works when it mirrors buying intent and revenue reality. It fails when it rewards cheap leads and surface metrics.
Meta campaigns provide rich intent signals. When integrated correctly, those signals guide sales prioritization and reduce internal friction.
Alignment improves when both teams trust the model. Trust grows from transparency, revenue linkage, and consistent review.