
Most advertisers spend a lot of time inside Meta Ads Manager. Fewer advertisers spend enough time analyzing what actually happened after campaigns ran.
That is where Meta Ads Manager for Excel becomes useful.
The tool allows advertisers to download ad performance data directly into Microsoft Excel 2016. Instead of reviewing one account at a time inside Ads Manager, advertisers can combine multiple ad accounts into one report and analyze performance more efficiently.
For agencies, growth teams, and businesses running several campaigns at once, this saves a surprising amount of time.
Why advertisers still use Excel for Meta campaign analysis
Ads Manager is good for monitoring campaigns live. Excel is often better for spotting patterns.
Inside Meta Ads Manager, it is easy to check daily spend, CPA, or ROAS. It is harder to compare trends across multiple accounts, placements, or date ranges at the same time.
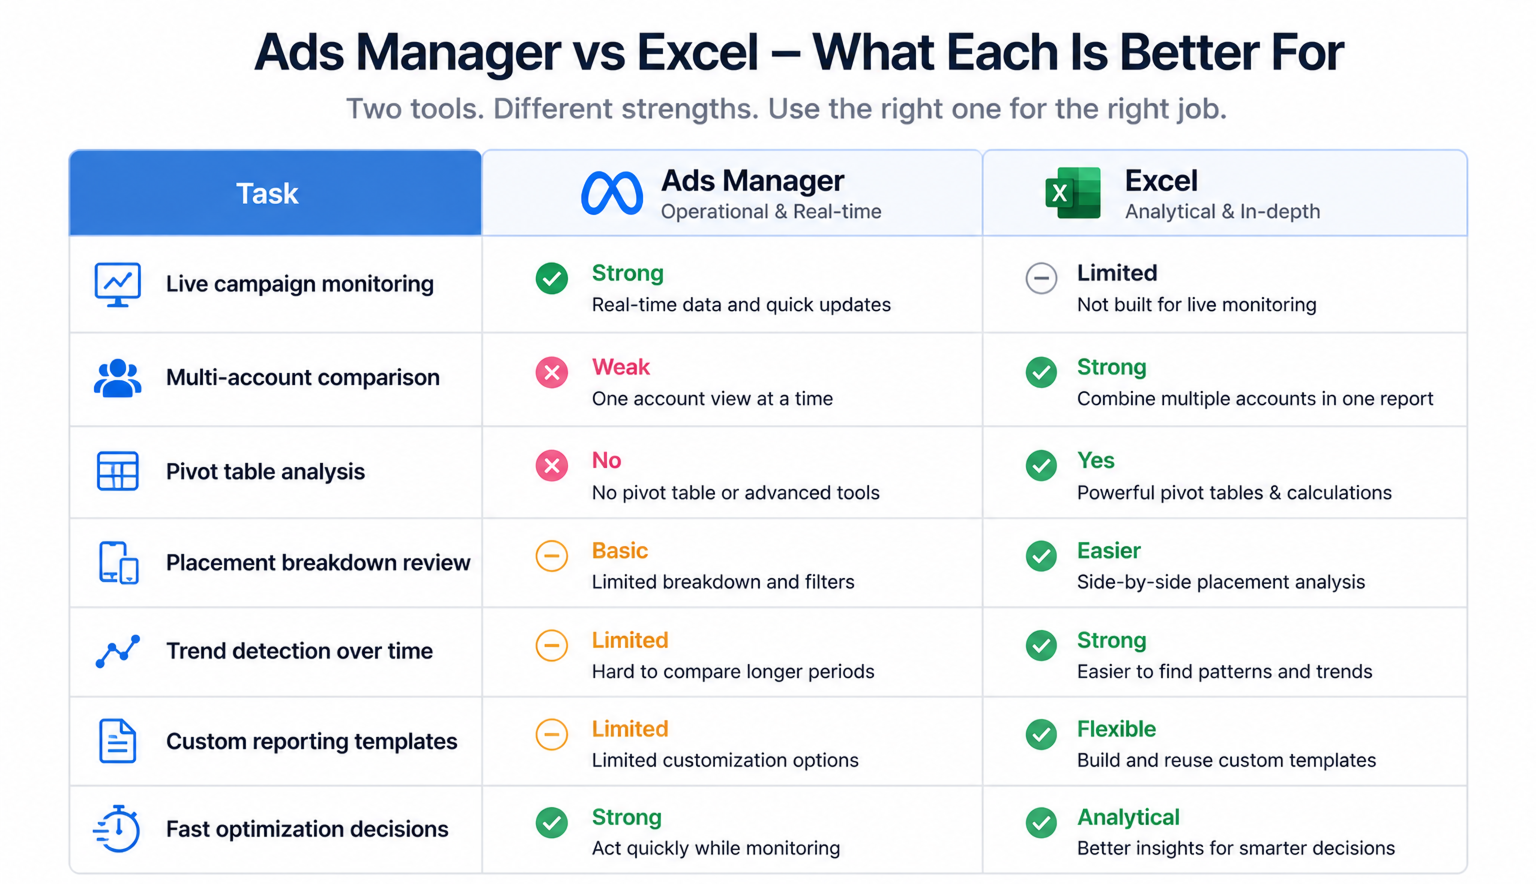
Excel gives advertisers more flexibility because they can:
- compare campaigns across several ad accounts;
- filter data by placements, objectives, or delivery status;
- analyze demographic performance more clearly;
- build pivot tables for deeper reporting.
This becomes especially useful when performance starts shifting slowly instead of collapsing all at once.
For example, CPM may rise only on one placement. Or one age group may suddenly produce weaker conversion rates while the rest of the campaign still looks stable.
Those patterns are easier to catch in Excel than inside a crowded Ads Manager dashboard.
Multi-account reporting helps agencies move faster
Agencies often manage several ad accounts at once. Exporting reports one account at a time creates extra manual work.
Meta Ads Manager for Excel solves part of that problem because advertisers can build one report across multiple accounts.
That matters during:
- weekly performance reviews;
- client reporting cycles;
- budget allocation decisions;
- campaign audits.
Instead of downloading separate files repeatedly, teams can refresh one report and review everything together.
This reduces reporting delays and helps advertisers react to performance changes faster.
Custom templates save time during reporting reviews
One of the most practical features inside Ads Manager for Excel is custom report templates.
Many advertisers review the same metrics every day:
- CPM;
- CPC;
- CPA;
- ROAS;
- frequency;
- conversion volume.
Without templates, teams rebuild those reports repeatedly.
Saved templates simplify that process because advertisers can keep the same structure across every reporting cycle. That creates more consistent decision-making across teams and clients.
It also reduces reporting mistakes caused by changing filters or attribution settings accidentally.
Faster report refreshes help advertisers spot problems earlier
Meta Ads Manager for Excel allows advertisers to refresh reporting data regularly. Reports can refresh every 15 minutes or once per day depending on the workflow.
That matters more than many advertisers realize.
Performance problems often appear gradually:
- CTR starts dropping first;
- frequency climbs slowly afterward;
- CPA increases a few days later;
- ROAS weakens once spend continues scaling.
If reporting updates happen too slowly, advertisers react after the damage is already expensive.
Faster refresh cycles help teams identify these changes earlier and make adjustments before campaigns become unstable.
Excel makes placement analysis much easier
Placement performance is one of the most overlooked parts of Meta campaign optimization. Many advertisers run automatic placements but rarely compare how each placement affects results.
Excel helps simplify this analysis because advertisers can compare placement data side by side.

A simple report may reveal:
- Feed placements generate stronger conversion rates;
- Reels placements drive cheaper clicks but weaker purchases;
- Audience Network increases reach but lowers lead quality;
- Stories placements fatigue faster than Feed placements.
These are real delivery patterns advertisers can verify directly inside campaign data.
Meta itself uses placement analysis as one example of how advertisers can use Ads Manager for Excel more effectively.
Common mistakes advertisers make with Excel reports
Excel reports help performance analysis, but only if advertisers focus on the right data.
A few reporting mistakes appear repeatedly:
- tracking too many metrics at once;
- comparing campaigns with different attribution windows;
- focusing only on low CPC instead of lead quality;
- ignoring frequency and placement breakdowns.
These mistakes usually create false optimization signals.
For example, a campaign may look efficient because CPC is low, while actual conversion quality keeps declining.
This is why advertisers should learn how to analyze ad metrics like a pro instead of relying only on surface-level numbers.
Excel reports become more valuable with better audience targeting
Better audience targeting makes reporting more important, not less.
LeadEnforce advertisers often build high-intent audiences from Facebook groups, Instagram followers, engagers, and social profile data. These audiences usually behave differently from broad targeting audiences.
That changes how advertisers read reports.
Cheap traffic matters less. Lead quality matters more. Placement efficiency becomes more important. Audience fatigue becomes easier to notice.
Excel reports help advertisers compare those audience behaviors more clearly across campaigns and ad accounts.
This is also why many agencies audit Facebook ads to uncover hidden wasted spend using exported reporting systems instead of relying only on Ads Manager views.
Final takeaway
Meta Ads Manager for Excel is not just a reporting convenience for advertisers who like spreadsheets.
It is a practical analysis tool for advertisers managing multiple campaigns, multiple accounts, and large amounts of performance data.
The biggest advantage is visibility.
Excel makes it easier to compare placements, track trends, organize reporting, and spot delivery problems before they become expensive.
For scaling advertisers, that often leads to faster optimization decisions and better control over campaign performance.