Q4 is the most critical period for e-commerce brands, bringing substantial spikes in traffic, competition, and customer expectations. To navigate this period effectively, brands must go beyond general performance numbers and track specific seasonal metrics that offer insight into shopper behavior and campaign efficiency.
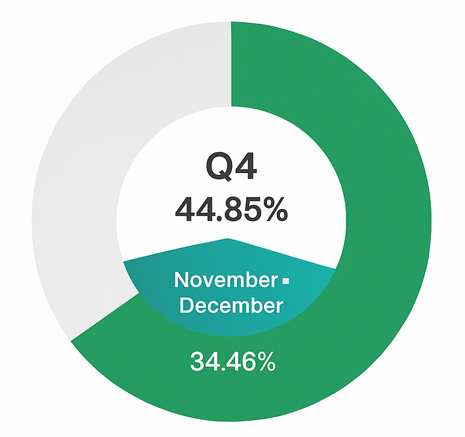
Nearly 45% of annual e-commerce revenue is generated in Q4, with over one-third just in November-December
Below are the essential metrics every brand should monitor to ensure they capture peak demand and maintain strong profitability.
1. Seasonal Conversion Rate
The conversion rate often climbs significantly during Q4 as purchase intent rises. Brands should compare weekly and even daily conversion fluctuations to identify key buying windows.
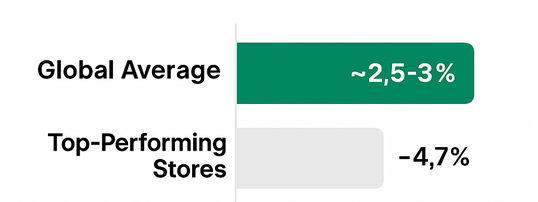
Typical e-commerce conversion rates range from ~2.5% to 3%, with the top 10% of stores hitting ~4.7%
Useful statistic: Many e-commerce retailers observe conversion rates rise by 30 to 50 percent during peak shopping events.
Tracking tip: Monitor conversion by traffic source to understand which channels capture the highest-intent shoppers.
2. Cost Per Acquisition (CPA)
With rising competition, CPA often spikes before major sales and quickly drops on event days as intent surges.
Useful statistic: In competitive categories, CPA can increase by 20 percent or more during the early weeks of Q4.
Tracking tip: Measure CPA variations around campaign launches, early access offers, and retargeting flows.
3. Cart Abandonment Rate
Q4 brings more browsing, price checking, and comparison shopping, often leading to higher cart abandonment.
Useful statistic: Cart abandonment rates average 70 percent across e-commerce but can rise above 75 percent during intense deal periods.
Tracking tip: Measure abandonment by device and checkout stage to identify bottlenecks and frictions.
4. Repeat Purchase Rate
Holiday buyers represent an opportunity to convert one-time seasonal shoppers into long-term customers.
Useful statistic: Brands that run structured post-purchase campaigns can increase Q1 repeat purchases by up to 25 percent.
Tracking tip: Track repeat rates across cohorts acquired before, during, and after major promotions.
5. Average Order Value (AOV)
Consumers often spend more during Q4, driven by gifting, bundles, and promotions.
Useful statistic: Many retailers see AOV rise between 10 and 20 percent during the holiday peak.
Tracking tip: Segment AOV by offer type to identify which promotions deliver the highest incremental value.
6. Frequency of Returning Visitors
Shoppers revisit stores multiple times before purchasing, especially when comparing deals.
Useful statistic: Returning visitors often convert at 2 to 3 times the rate of first-time visitors.
Tracking tip: Monitor returning user frequency to identify when audiences are most likely to convert.
7. Revenue Per Visitor (RPV)
RPV offers a high-level view of how efficiently traffic turns into revenue, combining both conversion rate and AOV.
Useful statistic: Small improvements in RPV during Q4 can yield significant gains due to high traffic volumes.
Tracking tip: Track RPV daily during major events to uncover performance patterns.
8. Customer Lifetime Value (LTV)
Brands that acquire high-LTV customers during Q4 generate longer-term profitability.
Useful statistic: Customers acquired in Q4 often show 15 to 20 percent higher lifetime value when targeted correctly.
Tracking tip: Evaluate LTV by acquisition campaign to identify the most valuable seasonal traffic sources.
Conclusion
Q4 presents exceptional opportunities for e-commerce brands, but success depends on tracking the right metrics at the right time. Seasonal behavior shifts quickly, and brands that respond to real-time signals gain a competitive edge. These metrics help identify demand surges, reduce wasted ad spend, and maximize profitability during the busiest shopping season.