Facebook and Instagram ads are more competitive than ever. In 2026, top-performing brands aren’t just spending more — they’re spending smarter. That starts with understanding the right data.
But not all metrics are created equal. Some give you real insight. Others just make your reports look better than your results.
This guide breaks down which metrics actually matter today and how to use them to improve performance, scale faster, and waste less budget.
Vanity Metrics: What They Are and Why to Be Careful
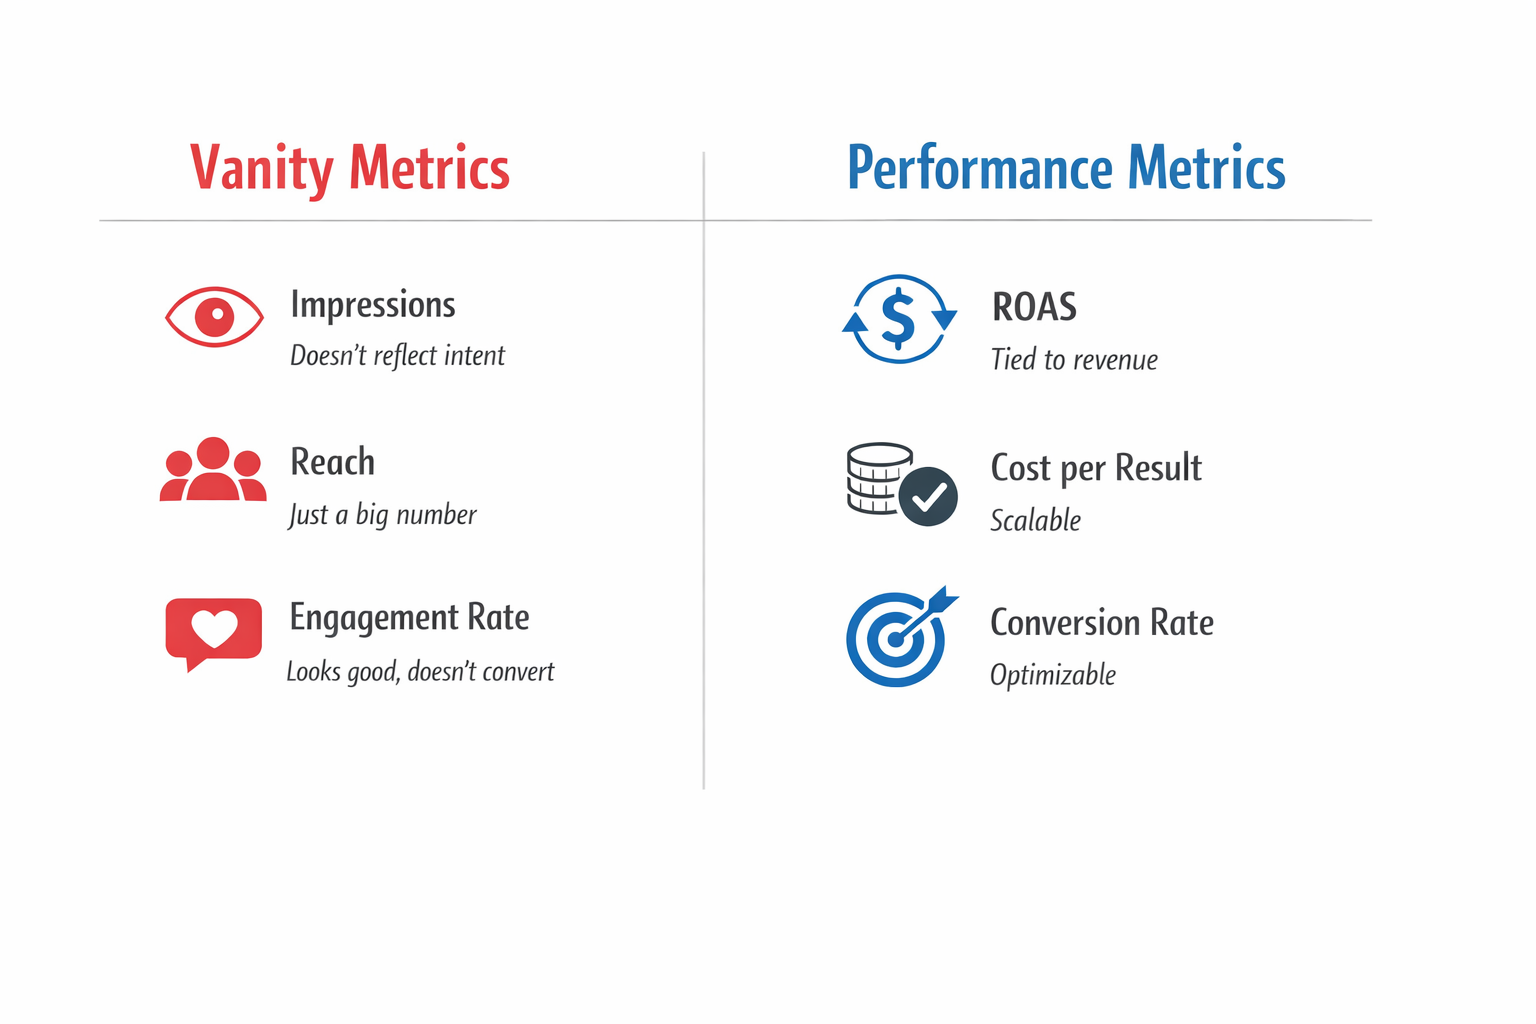
Vanity metrics are numbers that look good on the surface but don’t help you make better decisions. They often distract marketers from what’s actually working or not working.
Common Vanity Metrics
-
Impressions: How often your ad is shown to users.
-
Reach: The number of unique users who saw your ad.
-
Engagement Rate: The ratio of likes, comments, and shares to total impressions.
These numbers may sound impressive — but they don't reflect results.
For example, your ad might have 100,000 impressions but only bring in five leads. That’s not performance.
Vanity metrics are fine for understanding awareness. But if your campaign goals are leads, purchases, or sign-ups, they can mislead.
You should always combine them with performance-based data before making decisions. For a deeper dive into metrics that do predict conversions, read this article on data-driven decisions.
Performance Metrics: What to Track for Real Results
To truly optimize your campaigns, focus on metrics that are tied to business outcomes. These numbers show what’s working — and where your money is going.
Metrics That Matter
-
Return on Ad Spend (ROAS): How much revenue you generate for every dollar spent.
-
Cost per Result (CPR): The average cost to achieve your campaign goal (e.g., purchases, leads).
-
Conversion Rate: The percentage of users who take action after clicking your ad.
For example, if you’re spending $500 on Facebook ads and earning $1,500 in revenue, that’s a ROAS of 3. That tells you your ads are bringing in 3x what you’re spending — a key sign of profitability.
Cost per result helps you stay efficient. A low CPR means your ads are converting at a healthy rate. If CPR climbs, it may be time to test new creatives or targeting options.
Need a more advanced way to define your own performance goals? Check out how to use custom metrics for ad optimization.
Supporting Metrics: Understand What’s Behind the Performance
Some metrics don’t measure direct conversions, but they help explain what’s happening behind the scenes.
They’re great for testing creative, diagnosing problems, and planning your next move.
Metrics to Watch Closely
-
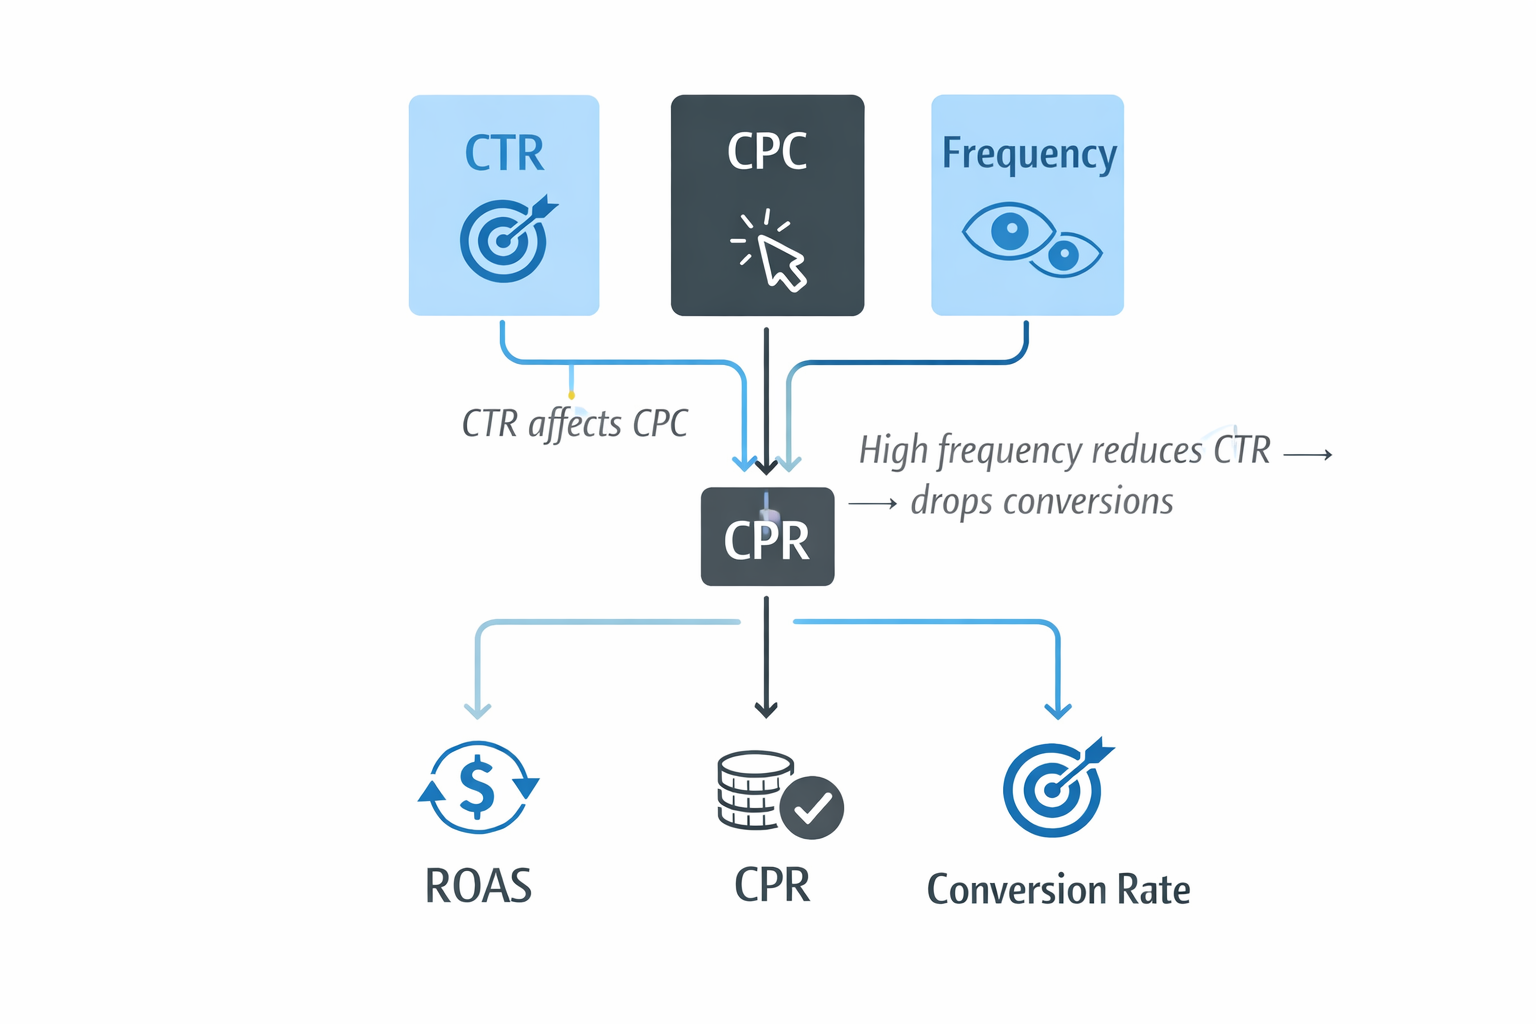
Click-Through Rate (CTR): The percentage of people who clicked after seeing your ad.
-
Frequency: How often the same person sees your ad on average.
-
Cost per Click (CPC): How much you’re paying per ad click.
CTR is especially helpful when testing creatives. If people aren't clicking, your hook might be weak, or your visuals may not be catching attention.
Frequency is key for avoiding ad fatigue. If your audience sees the same ad too many times, performance usually drops.
And CPC helps you understand your cost structure — if it's rising fast, you may be in a competitive auction or using poor targeting.
To learn how campaign structure can influence these numbers, read this breakdown of how Meta Ads campaign settings impact performance.
The New Role of Engagement in 2026: Quality Over Quantity
In 2026, Meta’s algorithm values the quality of engagement — not just the volume. That means not all likes or comments are treated equally when it comes to delivery and learning.
Engagement That Still Matters
-
Saves and shares: These show people see long-term value or want to revisit later.
-
Profile visits (especially on Instagram): Suggest curiosity or deeper interest in your brand.
-
Meaningful comments: Actual questions or feedback, not just emojis or one-word replies.
You can use these signals to shape your top-of-funnel content. If people are saving your ad or visiting your profile, your message is landing.
But keep in mind — these are indirect signals. They support performance, but shouldn’t replace your core metrics.
Attribution in 2026: Getting Smarter with Imperfect Data
Since iOS privacy updates and attribution changes, tracking exact conversions is harder than before.
That doesn’t mean you’re in the dark — it just means you need to work smarter with the data you do have.
Smart Attribution Practices
-
Use Meta’s 7-day click attribution window for more reliable tracking.
-
Combine Meta data with GA4, Shopify, or CRM tools to validate overall performance.
-
Track trends across campaigns instead of chasing exact match numbers.
If Meta shows 50 conversions and your backend shows 80, that’s okay — you’re seeing the same trend in both places.
What matters is direction and consistency, not a perfect match.
Recap: Focus on Metrics That Lead to Growth
Here's a quick summary of where to keep your attention and what to take with a grain of salt.
Metrics to Prioritize
-
ROAS: Tells you whether your campaign is profitable.
-
Cost per Result: Helps track efficiency across different objectives.
-
Conversion Rate: Reveals if your funnel and offer are working.
-
CTR: Indicates creative effectiveness.
-
Frequency: Helps manage ad fatigue and optimize delivery.
Metrics to Use with Caution
-
Impressions: Doesn’t mean anyone paid attention.
-
Reach: High numbers don’t equal results.
-
Engagement Rate: May look great, but not all engagement converts.
Let performance metrics lead your strategy. Use supporting metrics to fine-tune your creative and targeting.
And treat vanity metrics as background noise — interesting, but not decision-making tools.
Final Thoughts: Metrics Drive Strategy — If You Track the Right Ones
The success of your Facebook ads isn’t based on luck — it’s built on data. But only if you focus on the numbers that show you what’s actually working.
In 2026, smarter optimization means knowing which levers to pull and when. With the right metrics in place, you’re not guessing — you’re growing.