
In advertising, we’re often told that more data leads to better results. That sounds logical — but it’s not always true.
For marketers running Facebook and Instagram campaigns, too much data can actually make things worse. It creates confusion, slows down decisions, and leads to the wrong optimizations.
This article explains why more data isn't the solution and how to work with less — but higher quality — data instead.
The Real Problem with Data Overload
More dashboards, more breakdowns, more charts — none of these guarantee better performance. In fact, they often make it harder to see what really matters.
Too many advertisers try to track everything at once. The result? They miss the signals that drive actual growth.
Signal vs. Noise: How to Tell the Difference
Some metrics look useful on the surface but offer little insight. Others seem simple, but hold more weight when viewed in context.
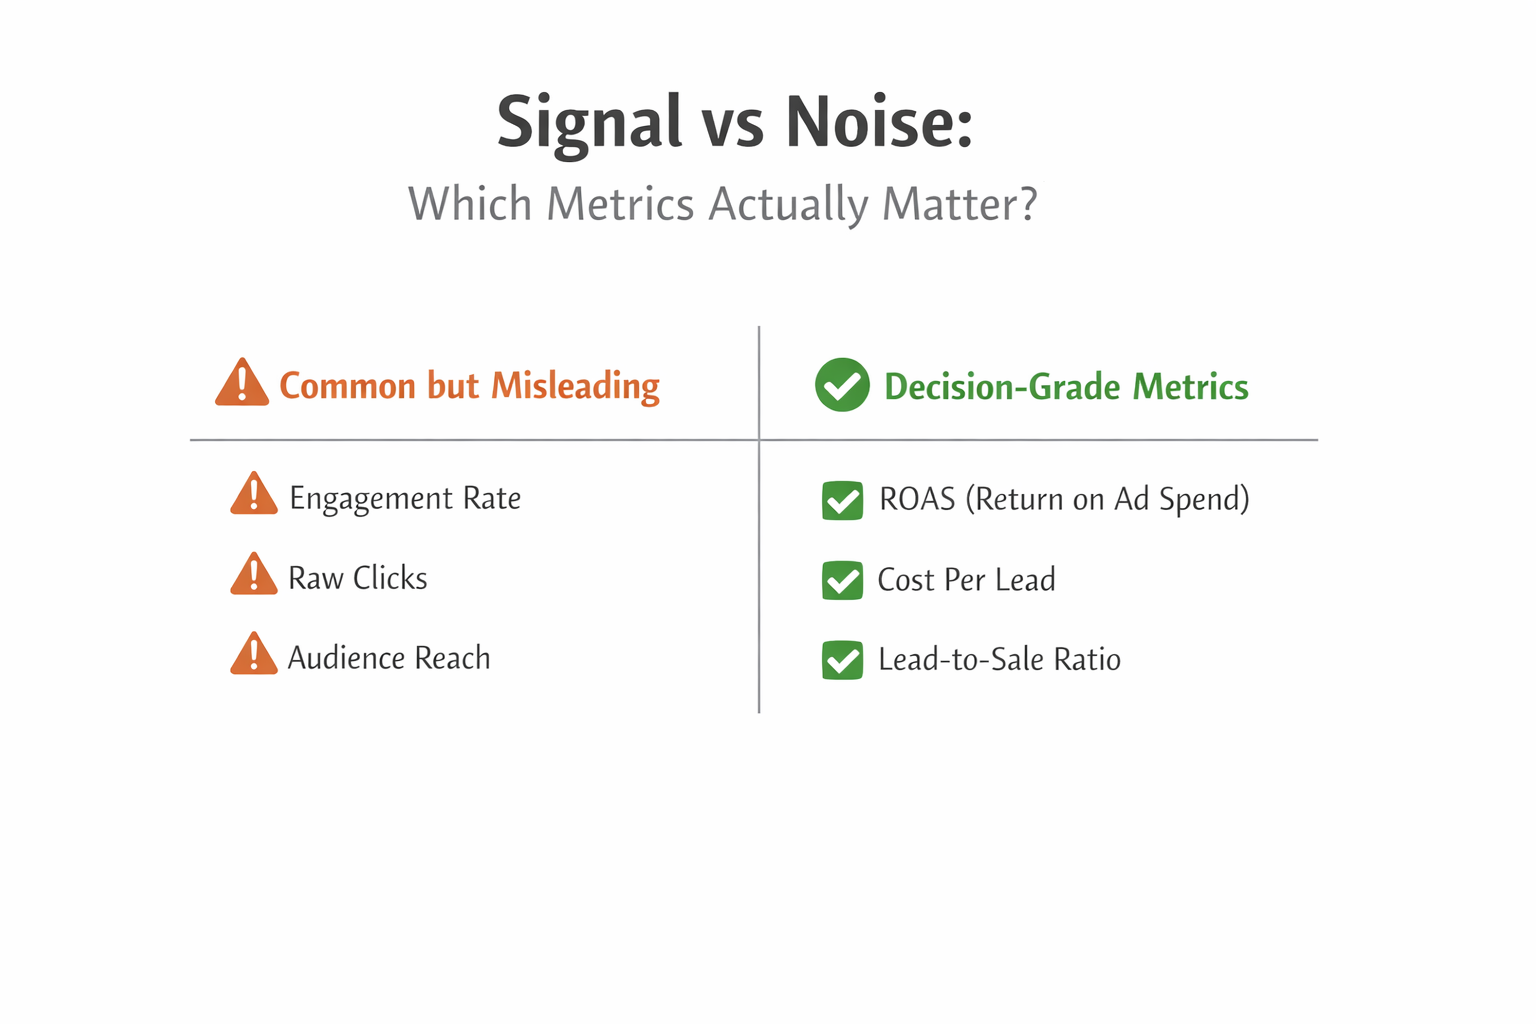
Here are three examples of metrics that are often misused:
-
Engagement rate, in isolation: A high engagement rate doesn’t always reflect intent. It may just show curiosity or confusion.
-
Clicks without follow-up data: Clicks are only meaningful if they lead to qualified traffic, low bounce rates, or conversions.
-
Audience reach: Reach can look impressive, but it says nothing about audience quality, purchase intent, or relevance.
Instead of tracking everything, focus on the few metrics tied directly to business outcomes — such as cost per qualified lead, conversion rate, and return on ad spend (ROAS).
Why More Data Can Hurt Performance
It’s not just about what you track — it’s how you use it. More data can lead to poor decisions, especially when campaigns are in early stages or audiences are small.
Small Samples, Big Mistakes
Running early-stage tests with limited traffic? Then overreacting to short-term data can completely throw off your strategy.
Here’s what that might look like:
-
Making decisions based on fewer than 500 impressions. The sample is too small for statistical confidence.
-
Pausing or editing ads within 24 hours of launch. This resets learning and wastes budget.
-
Treating day-to-day performance shifts as trends. Variability is normal — don’t overcorrect unless patterns hold for several days.
In these cases, “more data” gives you false confidence. What you really need is reliable data from stable, clean experiments.
If you’re stuck in this phase, you’ll benefit from reading How to Test Facebook Ad Creative When You Have a Small Audience.
Testing Too Many Variables at Once
Another common issue: trying to test everything at the same time — creative, audience, placements, optimization goals.
Here’s the problem:
-
If you test five elements at once, and performance shifts, you won’t know what caused the change.
-
When too many ad sets compete for the same budget, none of them get enough volume to reach learning phase completion.
For a better approach, consider this guide on What to Test First: Creative, Copy or Audience in Facebook Campaigns.
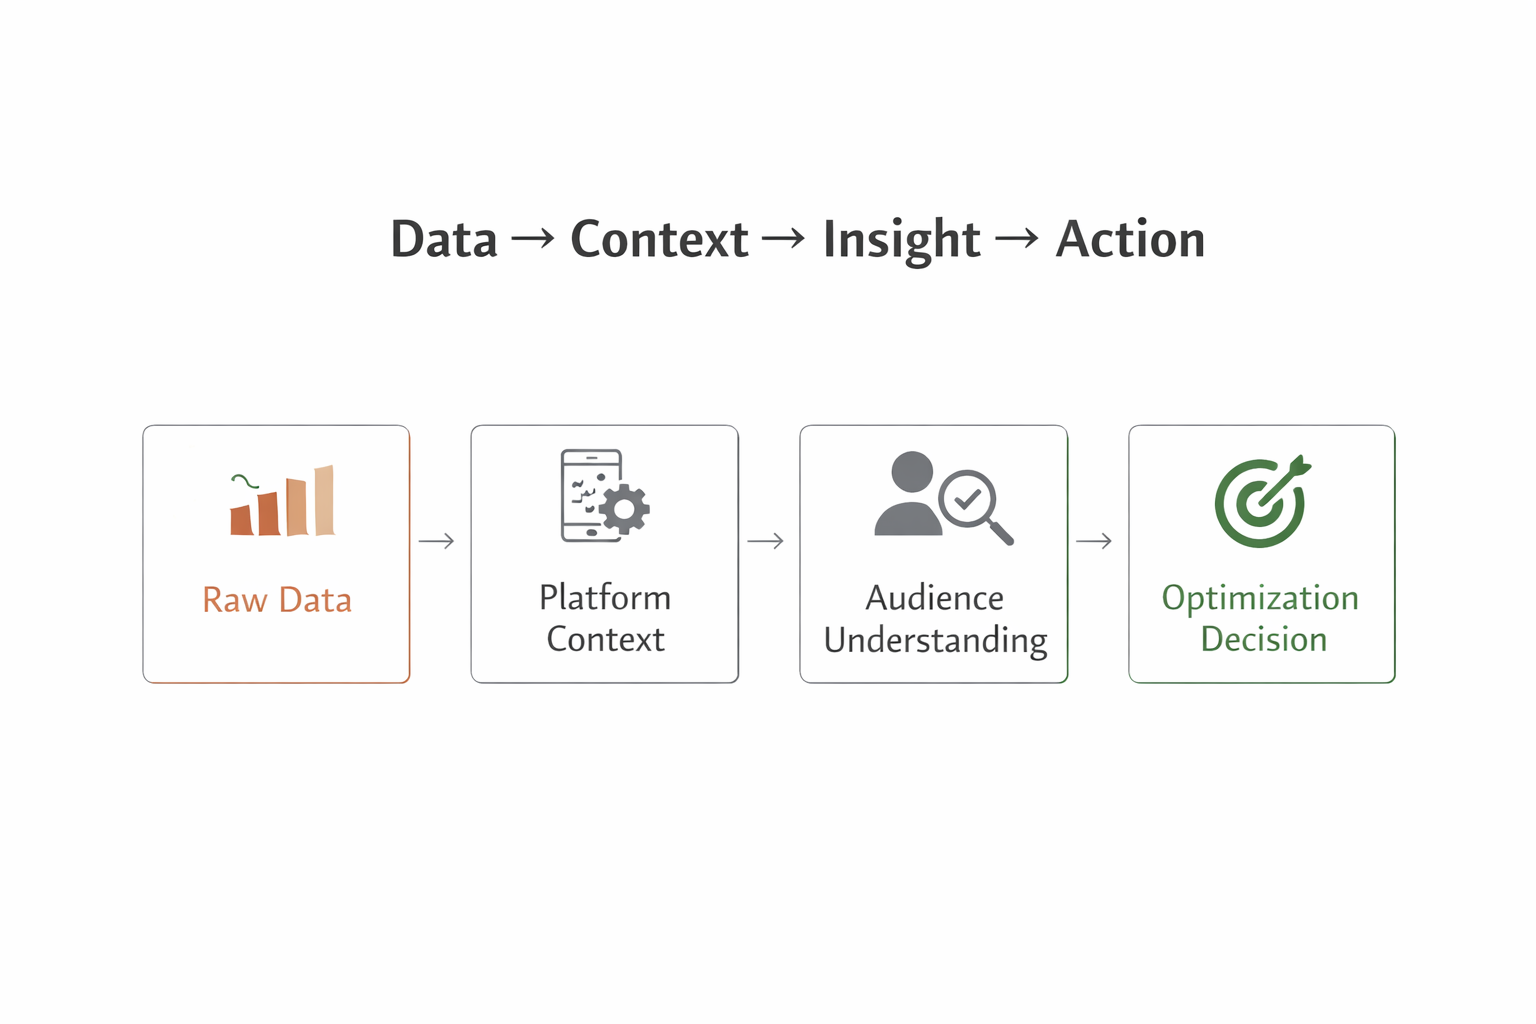
Raw Data Without Context Is Dangerous
Data is only as good as your understanding of the platform and your audience. Looking at numbers without that context leads to the wrong takeaways.
Misinterpreting Platform Signals
Sometimes Meta shows certain ads more often not because they’re better — but because they’re cheaper to deliver.
Here’s what might be happening:
-
The algorithm pushes one creative because it generates cheaper clicks — not because it’s more persuasive or relevant.
-
Your top-performing audience may actually be delivering low-value leads, but the metrics hide that until much later in the funnel.
If you optimize only for front-end data (like clicks or impressions), you risk undercutting long-term performance.
To go deeper, check out Why Facebook Ads Data Alone Can’t Explain True ROI.
How to Focus on the Right Data
More data is only helpful if it supports faster, clearer decisions. To achieve that, narrow your focus to decision-grade signals.
Use Cohort-Level Metrics
Rather than tracking one-off actions, look at how users behave over time in specific audience segments. That’s where patterns emerge.
Examples:
-
How many users who watched 75% of your video actually clicked through and converted?
-
What’s the cost per purchase for warm audiences vs. cold ones — over a full 7-day window?
-
Are users from certain sources (e.g., Instagram Stories vs. Feed) consistently bouncing after the first page view?
For deeper guidance, review How to Analyze Facebook Ad Performance Beyond CTR and CPC.
Track Metrics That Drive Decisions
Here are a few examples of metrics that provide a strong foundation for optimization:
-
Cost per result: Helps you compare performance across ad sets and decide where to allocate budget.
-
Lead-to-sale conversion rate: Tracks not just acquisition, but quality. If leads aren’t converting, revisit your targeting or messaging.
-
Time on site and bounce rate: Shows how well your ads align with your landing page experience.
Every metric you track should answer one of two questions: Is this working? or What should I do next?
When Less Data Delivers Better Results
Sometimes the best-performing campaigns are built on a small set of well-understood insights — not giant datasets.
Here’s an example:
A B2B SaaS company tested 8 ad creatives, 3 landing pages, and 2 headline variants. The creative with the lowest click-through rate ended up driving the highest-quality leads, with a 27% close rate.
Why? It spoke clearly to their target buyer — even if fewer people clicked.
If they had optimized for clicks, they would have killed the ad that was actually winning.
Also worth reading: Why Some Audiences Never Convert (and How to Identify the Right Ones).
Final Thoughts: Clarity Beats Complexity
More data isn’t the answer to every ad problem. In fact, it’s often a distraction.
The goal isn’t to track more. It’s to see clearly, act faster, and build systems that compound over time.
When in doubt, simplify. Focus on the signals that lead to better decisions. And leave the noise behind.