Running ads on Facebook and Instagram comes with endless metrics. But only a few of them help you connect ad spend to actual business outcomes.
The real challenge isn’t just measuring performance. It’s choosing the right indicators — ones that tell you not just what happened, but what actually matters to your business. Without these, your reports look busy but lack direction.
In this article, we’ll break down the core advertising KPIs that help you spend smarter. We’ll also show how to interpret them in context and use them to make better decisions.
What Are Advertising KPIs?
Advertising KPIs (Key Performance Indicators) are metrics that reflect whether your ad campaigns are meeting specific business objectives.
Unlike platform engagement stats, KPIs help you evaluate performance through a business lens. They answer key questions like: Are we acquiring customers profitably? Are we converting the right audience?
A strong KPI should:
-
Measure a value-generating action, such as a purchase, lead submission, or signup;
-
Be easy to track and compare over time using reporting tools like Meta Ads Manager or third-party dashboards;
-
Reflect the intent and stage of your campaign — from awareness to conversion.
The better your KPIs match your business model, the more actionable your data becomes.
For deeper insights, read What Facebook Metrics Matter Most for Ad Optimization in 2026.
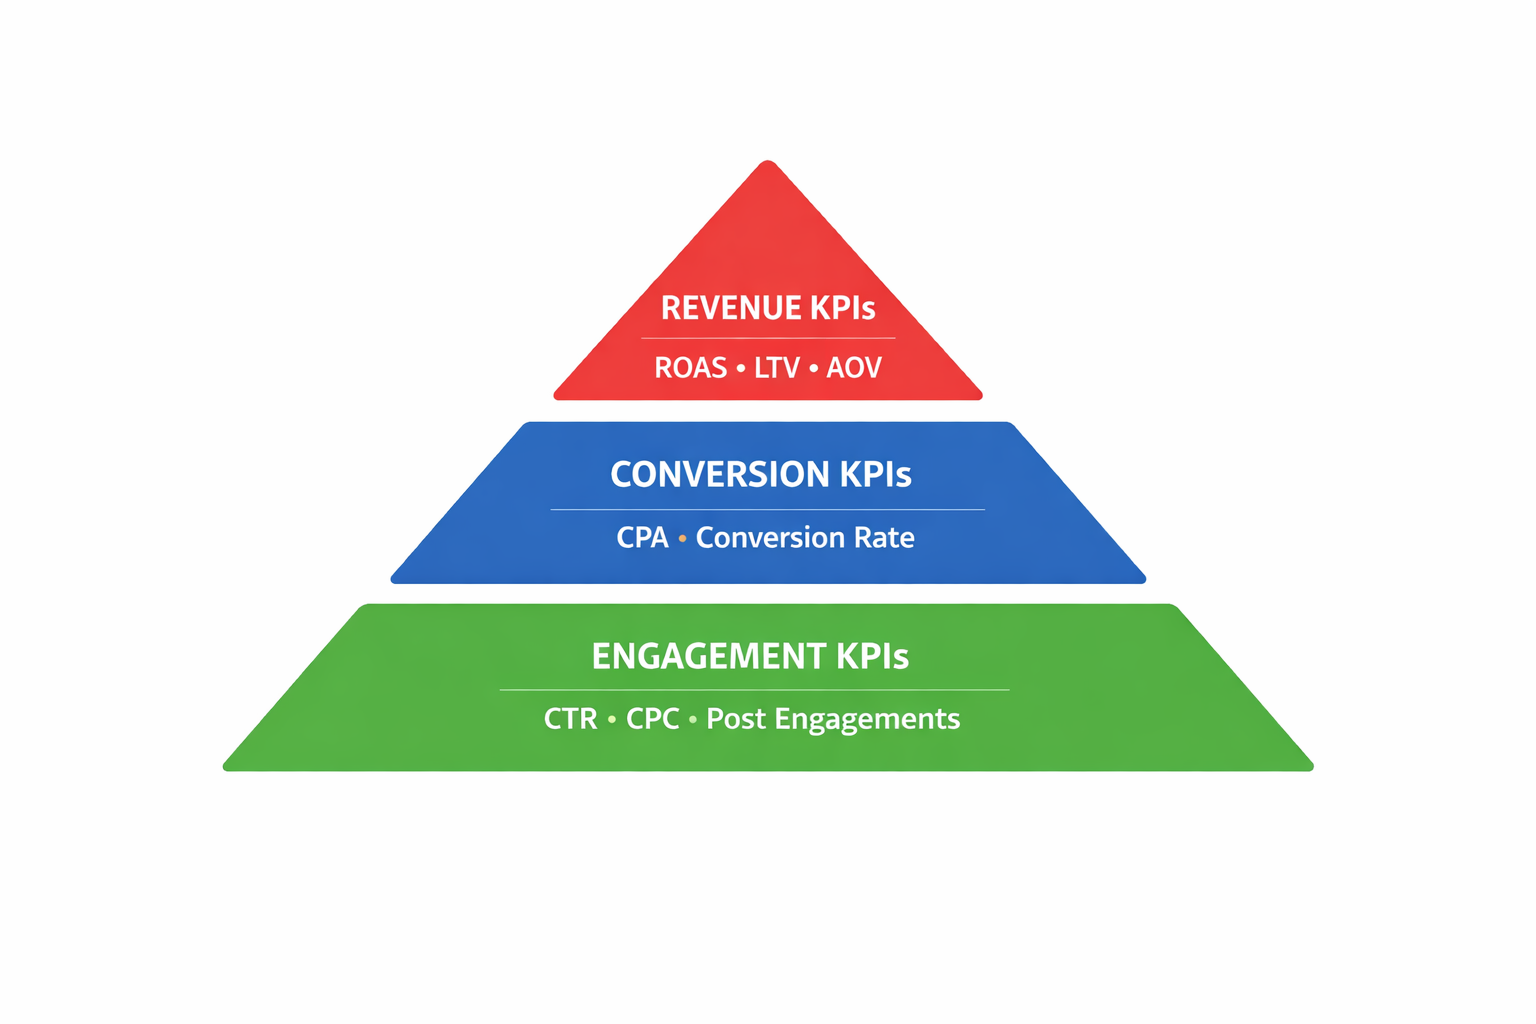
Engagement KPIs: Good for Diagnosing, Not for Judging ROI
Engagement KPIs tell you how users interact with your ads. While these metrics won’t reveal your bottom-line performance, they can help diagnose creative issues or flag early interest.
Click-Through Rate (CTR)
CTR is the percentage of people who clicked on your ad after seeing it. A high CTR often means your creative or copy resonates. But a high CTR without conversions can signal a disconnect between the ad and the landing experience.
Use Case: You’re testing two Instagram Story headlines. One delivers a 1.2% CTR; the other 0.4%. That’s a clear signal about which concept performs better at grabbing attention.
Learn what a good CTR looks like by industry.
Cost Per Click (CPC)
CPC tells you how much you’re paying for each click. Lower CPCs usually suggest relevance. However, they don’t always indicate quality traffic. Context is key.
Example: You pay $0.80 CPC for your skincare ad and $1.50 for your fitness campaign. If the former also drives better conversions, it may be time to reallocate your spend.
Post Engagements
This includes likes, comments, shares, saves — any kind of user interaction with your post. These numbers can help you refine your message and build custom audiences.
Use Case: A video ad gets high engagement but poor CTR. This suggests it may be more suitable for top-of-funnel awareness or as part of a retargeting strategy.
Conversion KPIs: Where Real Performance Starts
Conversion KPIs are your primary tools for understanding whether your campaigns drive actual business results. These are the metrics to prioritize if your goal is sales, sign-ups, or lead generation.
Cost Per Acquisition (CPA)
CPA represents how much you spend to get a conversion — whether that’s a lead, app install, or purchase. It includes every touchpoint leading to that action.
Example: You spend $500 and generate 25 purchases. That’s a $20 CPA. If your margin is $40 per sale, you're in good shape. But if margins are thin, even a modest increase in CPA could make the campaign unprofitable.
Tip: Track CPA separately for cold and warm audiences.
High CPA? Fix These Facebook Targeting Mistakes.
Conversion Rate
This is the percentage of users who complete your goal after clicking. It's one of the clearest indicators of offer alignment and landing page performance.
Use Case: You’re seeing strong CTRs but weak conversion rates. That tells you the problem lies after the click — likely in the landing page copy, UX, or offer.
Add to Cart / Checkout Initiated
These events help you measure intent before a purchase. They're also useful for building retargeting audiences or diagnosing where drop-offs occur in your funnel.
Example: One ad drives many "Add to Cart" events but few purchases. The issue could be friction at checkout — high shipping costs, account creation, or poor mobile UX.
Revenue KPIs: Connecting Spend to Profit
If you're scaling or running performance-based campaigns, revenue KPIs are essential. These metrics connect clicks to business outcomes — and ultimately determine profitability.
Return on Ad Spend (ROAS)
ROAS tells you how much revenue you earn per dollar spent. It’s one of the most referenced KPIs in performance marketing.
Use Case: Your campaign starts with a ROAS of 5.0. After scaling, it drops to 2.8. This signals saturation or poor audience quality. You may need to rotate creatives, expand targeting, or pull back spend.
Learn how to protect ROAS in volatile campaigns.
Customer Lifetime Value (LTV)
LTV estimates the total revenue a customer will bring over their relationship with your business. Knowing this helps determine how much you can afford to pay for acquisition.
Example: Your LTV is $120. If your CPA is $30, you’re likely profitable. If it’s $80, you'll need stronger retention or lower acquisition costs.
LTV becomes especially important in subscription models and SaaS.
Average Order Value (AOV)
AOV tells you how much customers spend per purchase. This is a lever you can directly influence with upsells, bundles, or tiered discounts.
Use Case: You have a $25 CPA and a $45 AOV. That margin may feel tight. Introduce bundles or time-limited offers to raise AOV to $60+.
Explore AOV Optimization Tactics.
Match KPIs to Campaign Stage
Don’t measure awareness campaigns with purchase KPIs. Don’t judge conversions by engagement. Every stage of your funnel needs its own focus.
Awareness (Top of Funnel)
Use this stage to introduce your brand and test different creative angles. It’s not about selling — it’s about attention.
Recommended KPIs:
-
Impressions (to gauge reach);
-
CTR (to measure curiosity);
-
Video Plays or Profile Visits (to assess interest).
Focus on breadth, message testing, and audience exploration.
Consideration (Mid-Funnel)
Now you need to deepen interest and drive users closer to conversion.
Recommended KPIs:
-
Landing Page Views;
-
Cost per Landing Page View;
-
Add to Cart or Sign-Up Initiated Events.
At this stage, alignment between message, targeting, and offer is critical.
Conversion (Bottom of Funnel)
This is where you close. Your KPIs should reflect revenue, profitability, and customer acquisition efficiency.
Recommended KPIs:
-
ROAS (to measure efficiency);
-
CPA (to track cost-effectiveness);
-
Purchase Events (to gauge absolute performance).
Every optimization here should support margin and scalability.
Final Thought: Use KPIs to Guide Real Decisions
Metrics only matter when they shape better choices. Tracking KPIs without context just adds clutter.
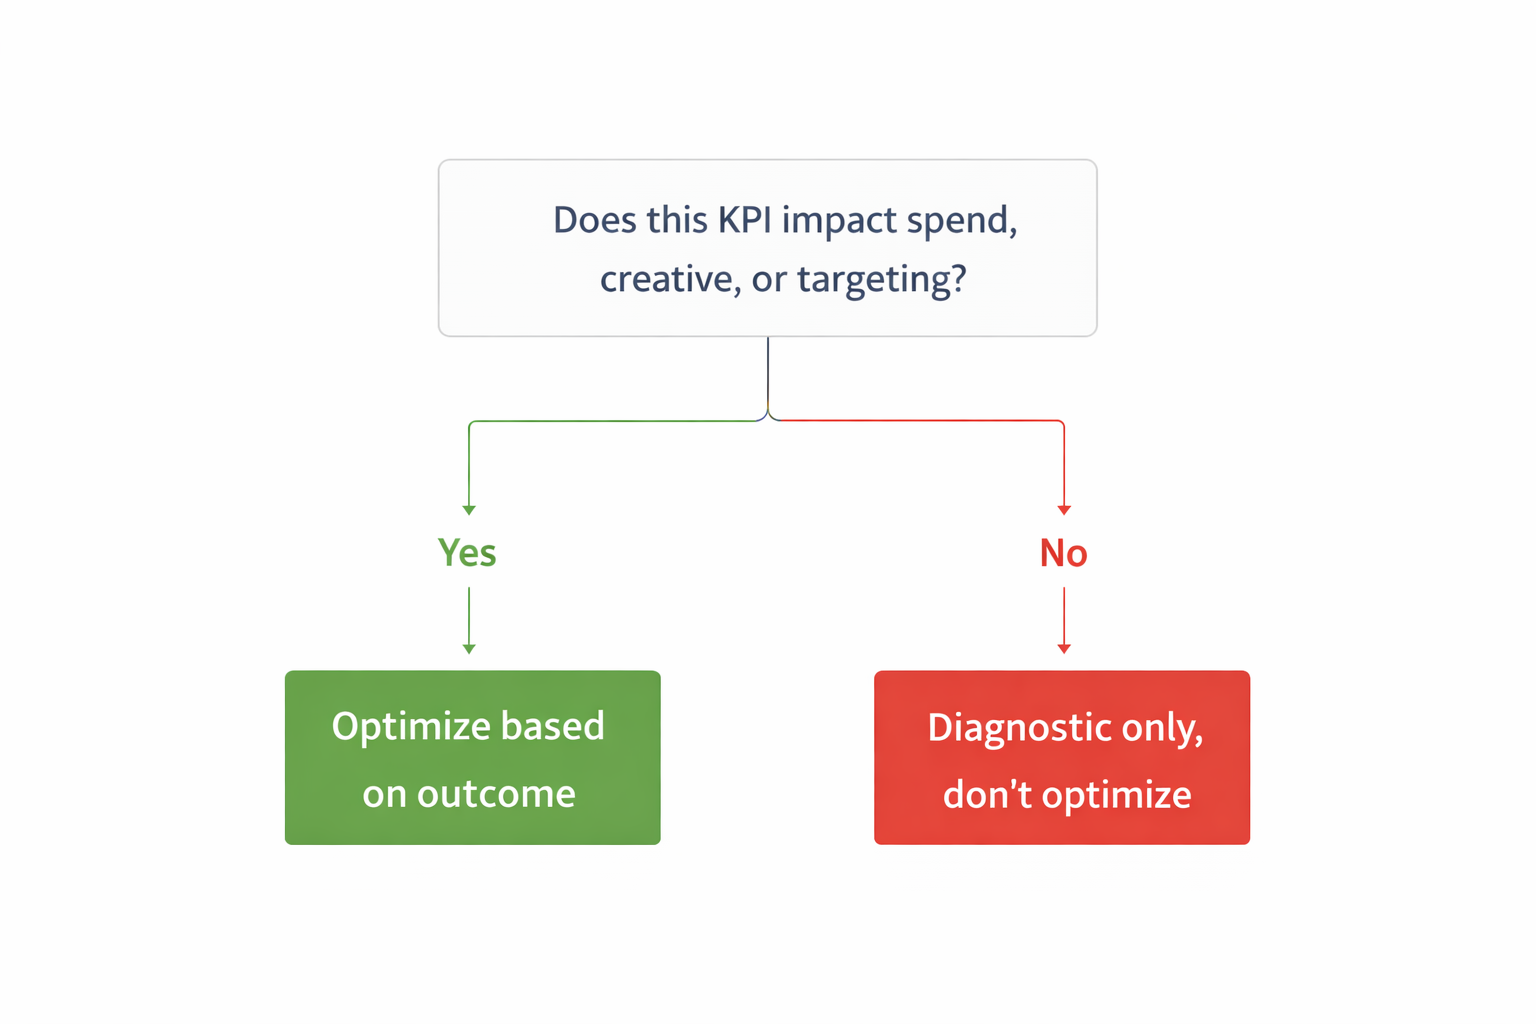
Before you optimize, ask:
-
What does this KPI really tell me about audience intent or campaign quality?
-
Is it guiding spend allocation, creative changes, or targeting adjustments?
-
Are we measuring what matters for the current stage and business model?
When you focus on outcome-driven metrics, every decision becomes clearer. You stop guessing. You start scaling.
And most importantly — your ad spend starts working like an investment, not a gamble.