Most advertisers track quick wins — low CPCs, high CTRs, or short-term ROAS. But these numbers rarely tell you if a campaign is built to last.
To grow profitably, you need to measure what actually leads to long-term success: high-quality signals, sustainable performance, and user behavior that compounds over time.
This article breaks down advanced metrics top advertisers rely on — especially on Meta platforms like Facebook and Instagram. These metrics help you identify what’s working beneath the surface.
Why common metrics are often misleading
Click-through rate (CTR), cost per click (CPC), and even return on ad spend (ROAS) can give a false sense of progress. That’s because they reward surface-level actions — not real outcomes.
A high CTR might come from clickbait creative. A great ROAS in the first 48 hours may fade when scaling. And a low CPC doesn’t mean a user will ever convert.
Experienced marketers go deeper. They track how ads behave over time, across audiences, and after the initial click. This approach aligns closely with how to analyze Facebook ad performance beyond CTR and CPC.
Metrics that reveal deeper success
1. Post-click behavior
Measuring what happens after someone clicks is far more useful than tracking the click itself. It helps you understand the quality of the traffic your ads are driving.
Look at metrics like:
-
Time on site: Visitors who stay under 10 seconds likely bounced without reading or buying.
-
Scroll depth: If most users only see the top 25% of your page, they aren’t engaging with your message.
-
Secondary actions: Page views, product clicks, email signups, or any interaction beyond the landing page.
These signals tell you whether your ad is attracting the right kind of user — not just any user. For more, read Optimizing for post-click experience: what happens after.
2. Creative fatigue and decay rate
It’s not enough for a creative to perform well on day one. You need to know how long it holds up under pressure — across spend, placements, and audience segments.
To measure this, track:
-
Decay rate: How quickly does performance drop after launch? A strong ad holds for 5–10 days or more.
-
First-time impression ratio: Are you still reaching new people, or just repeating the same views?
-
Performance vs. frequency: Are higher ad views per person improving results or hurting them?
Creative fatigue often shows up before CTR drops or CPM rises. See how to avoid ad fatigue and keep optimal ads conversion rate for early detection tips.
3. Conversion delay curve
Most advertisers focus on same-day purchases. But many of your best customers — and most profitable — don’t buy immediately.
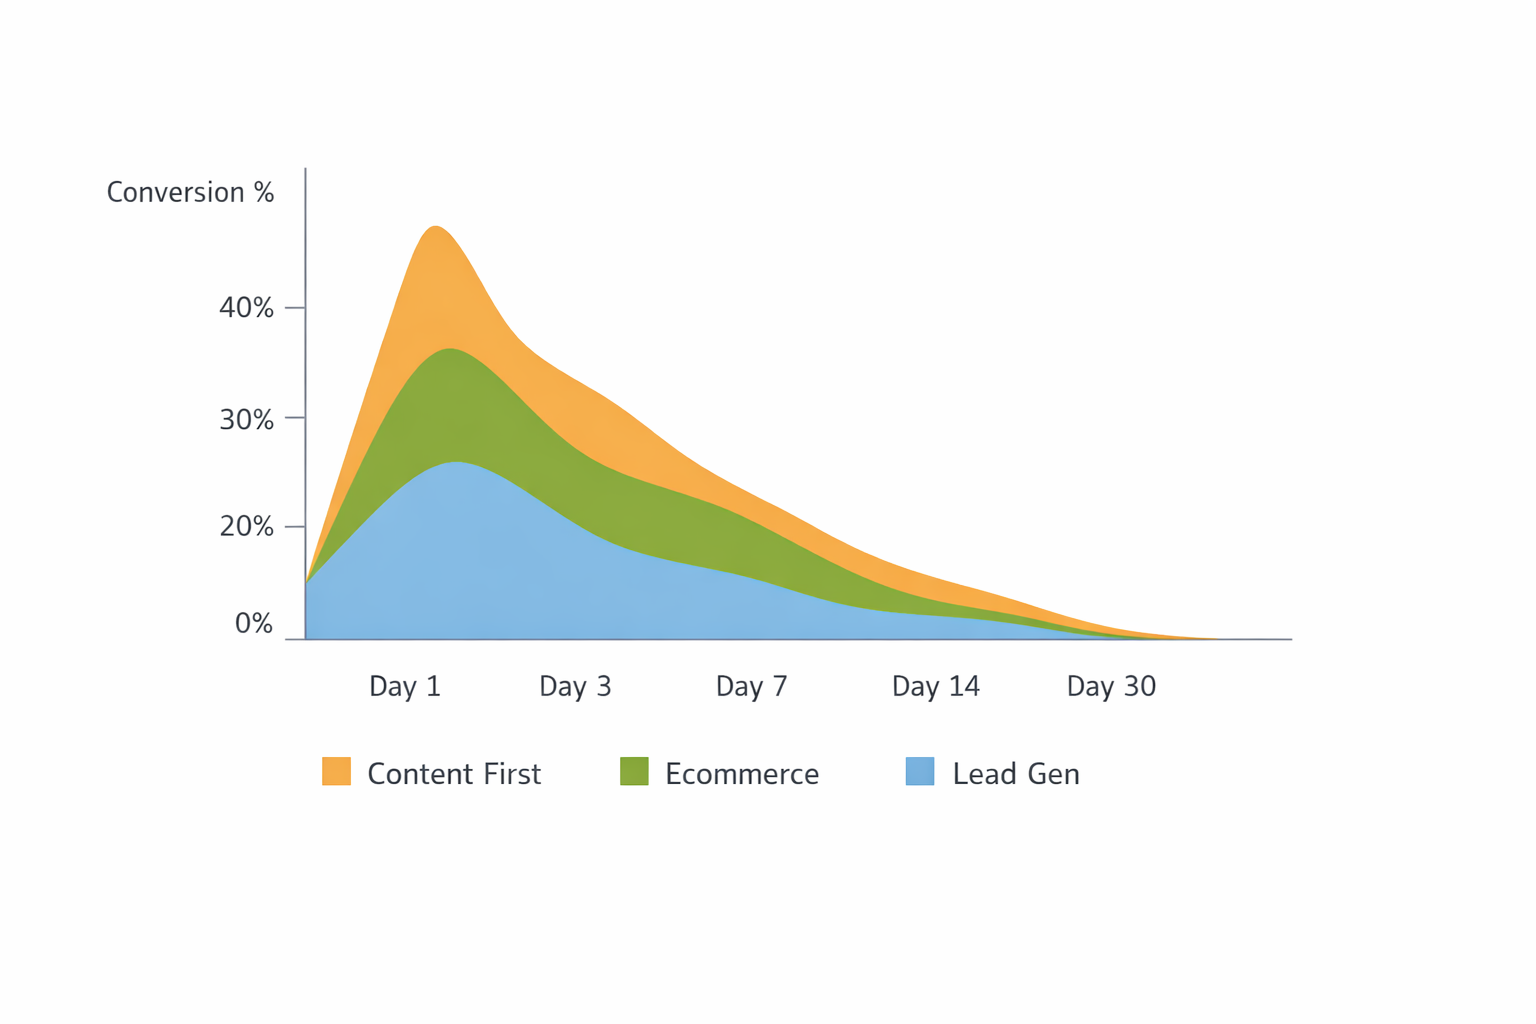
Study how long it takes users to convert after first seeing an ad:
-
1-day, 3-day, 7-day, and 14-day conversion splits: This shows how fast your funnel works.
-
Post-campaign conversions: Are people still buying days after you stop running the ad?
-
Cross-channel retargeting lift: Do later touchpoints (like email or search) close the sale?
Understand how attribution timing can skew what you see by reading Attribution lag in Facebook ads: why results look better (or worse) days later.
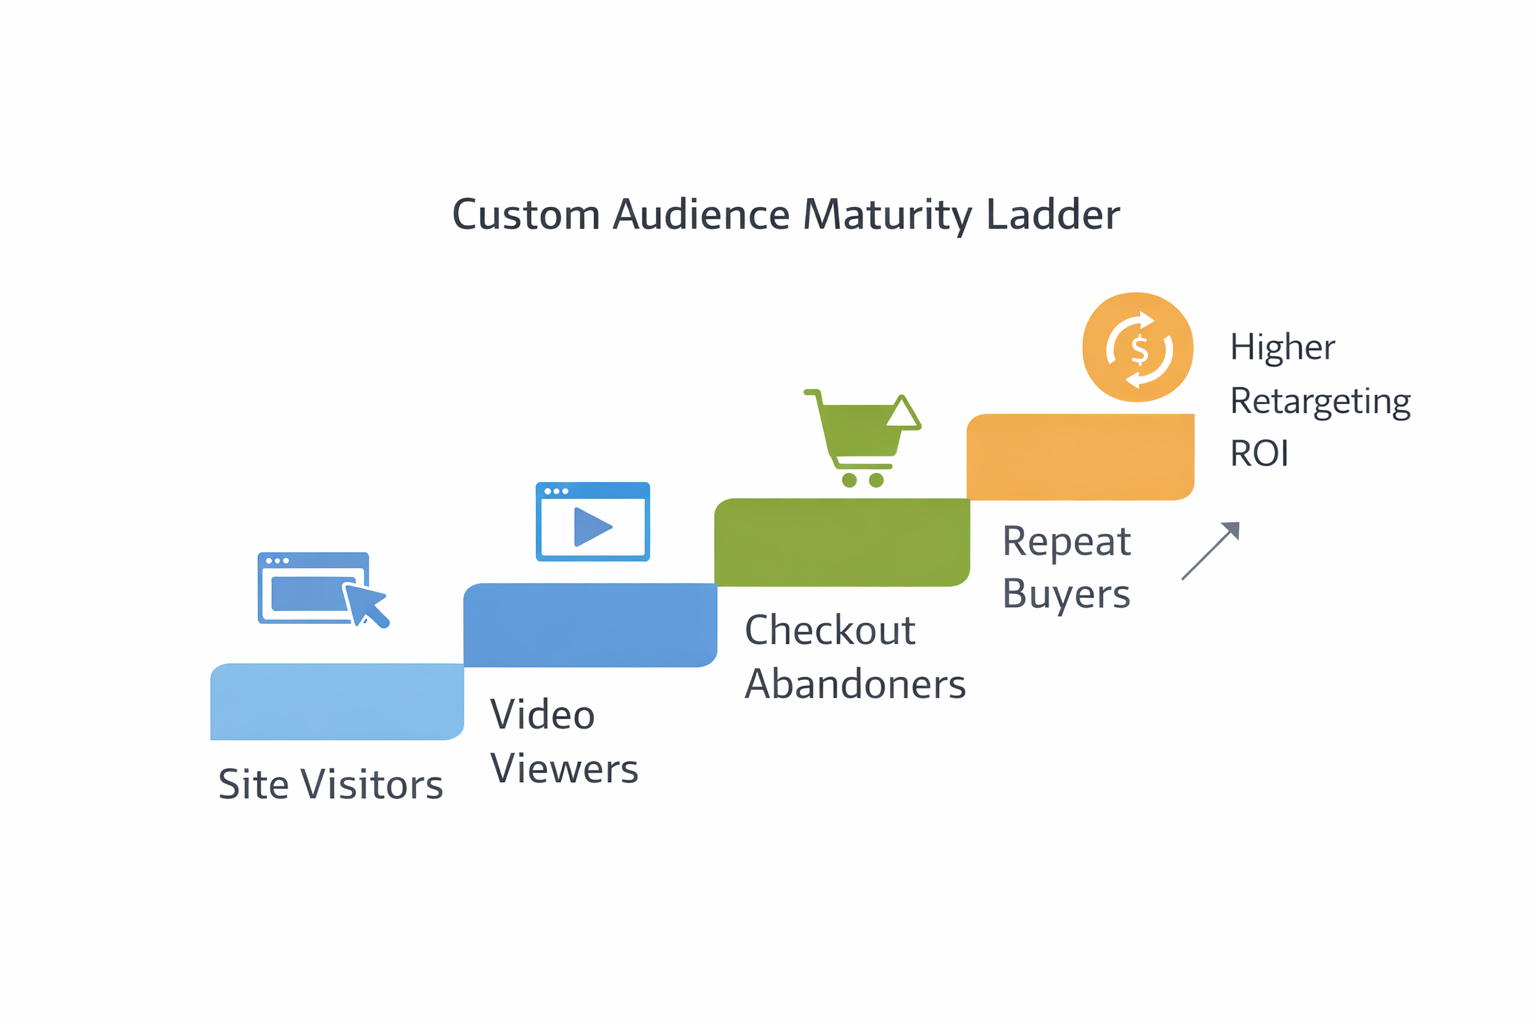
4. Growth of high-intent custom audiences
If your campaign is working, it should steadily build up pools of valuable users you can retarget later. Focus on audiences built from meaningful engagement — not just any site visit.
Track the growth of:
-
75%+ video viewers: Users who watched most of your video are signaling real interest.
-
Add-to-carts or checkout initiators who didn’t purchase: These people have high intent but may need a nudge.
-
Commenters, savers, or people who shared the ad: These actions suggest emotional or social relevance.
To learn which metrics actually matter at this stage, explore What Facebook metrics really matter when testing new audiences.
How Meta’s algorithm rewards long-term quality
Many advertisers still focus on CPM and CTR — but that’s not what Meta rewards anymore. The auction favors total value per impression, based on a mix of on-platform and off-platform signals.
Meta’s delivery system gives better reach and lower costs to ads that generate:
-
Strong conversion signals: Users who click and buy.
-
Positive engagement: Reactions, shares, saves, and replies.
-
Low negative feedback: Fewer hides, reports, or "not relevant" ratings.
You’re rewarded not for being flashy — but for being useful and relevant to the right people. The system favors ads that generate good outcomes for users, not just advertisers.
Expert-level metrics to add to your dashboard
If you want to scale efficiently, you need more than the basics. These less common metrics give a clearer picture of actual campaign health.
1. Value per impression (VPI)
Calculate total revenue divided by total impressions. Use this to compare performance across creatives, placements, and audiences — even when spend is uneven.
It’s a reliable way to find the most efficient combinations at scale.
2. True ROAS over time
Short-term ROAS is only part of the picture. Measure:
-
30-day and 60-day ROAS: Include delayed conversions and recurring purchases.
-
Returning customer revenue: Are customers coming back and spending more?
-
Blended customer acquisition cost (CAC): Factor in organic and repeat actions over time.
These numbers reveal which campaigns create lasting value, not just instant spikes.
3. Repeat action rate
This shows whether people are taking the next step after your ad.
-
For lead generation: Do users open emails, book calls, or attend webinars after signing up?
-
For ecommerce: Do customers come back to buy again within 30–90 days?
This metric is often more predictive of success than a single purchase or sign-up.
How to structure a scalable measurement system
Tracking smarter starts by breaking metrics down across three levels: creative, audience, and funnel. This structure helps you test more effectively — and optimize what actually drives profit.
Creative-level tracking
Monitor things like:
-
Thumbstop rate and video hold %: Are people paying attention?
-
Fatigue curve: How long does the creative stay effective?
-
Performance consistency across audiences: Does it work broadly or only in one niche?
Good creative holds up across placements and keeps working even as frequency rises.
Audience-level tracking
Keep tabs on:
-
Cost trends across audience types: Which groups stay efficient as you scale?
-
High-value custom audience growth: Are you building a retargeting engine?
-
Purchase behavior per segment: Are some audiences producing higher average order values or retention?
This helps you allocate budget to the audiences that matter most.
Funnel-level tracking
Zoom out and analyze the full path to conversion:
-
Time to convert: Are people buying on day 1, day 7, or day 14?
-
Multi-touch ROAS: Are multiple touchpoints working together?
-
Message alignment: Are users getting consistent messaging from ad to landing page to email?
When all stages support each other, scaling becomes easier and cheaper.
Final advice: track what compounds, not just what spikes
Short-term metrics are easy to chase. But they rarely lead to sustainable growth. Long-term success comes from tracking the signals that compound: behavior after the click, audience value over time, and how creative holds up under scale.
If you want to scale profitably, stop asking “What’s my best CTR?” and start asking “Which signals predict future success?”
That shift is what separates good campaigns from great ones.