
In today's fast-paced marketing world, understanding how to measure and predict the success of your advertising campaigns is essential for driving better results. Whether you're managing a digital ad campaign, social media ads, or traditional advertising channels, using the right performance metrics can give you deep insights into what's working and where improvements are needed.
Key Advertising Performance Metrics
1. Click-Through Rate (CTR)
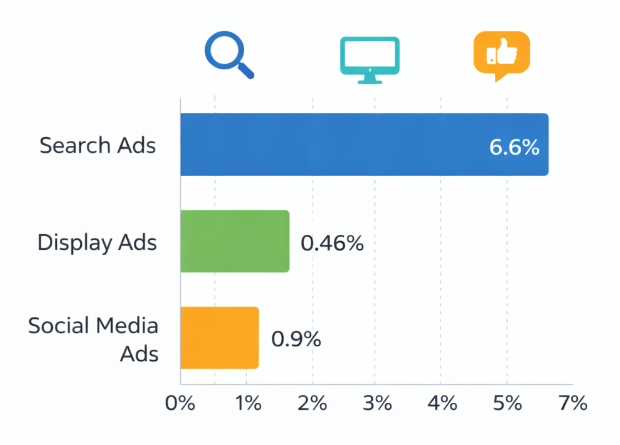
Comparison of average click-through rates (CTR) across major advertising formats, showing how engagement varies by ad type
Click-Through Rate (CTR) measures how effective your ads are at getting users to engage. It is calculated by dividing the number of clicks an ad receives by the number of impressions. A higher CTR indicates that the audience is responding well to your ad's messaging and targeting.
-
Why it's important: A higher CTR shows that your ad is relevant to your audience, and it usually means your ad copy and creative are compelling.
-
Average CTR: Industry benchmarks suggest that the average CTR for display ads across various industries is around 0.46%. However, this figure can vary greatly based on the ad type, industry, and the platform being used.
2. Conversion Rate
Conversion Rate (CR) is one of the most telling metrics in determining the effectiveness of your advertising campaigns. It measures the percentage of visitors who take the desired action (e.g., completing a purchase, signing up for a newsletter) after clicking on an ad.
-
Why it's important: Conversion rate directly impacts your ROI. High conversion rates generally indicate that your ad's targeting, message, and landing page are optimized for your audience.
-
Industry Average: Conversion rates can range from 2% to 5%, with the best-performing campaigns reaching over 10%.
3. Cost Per Acquisition (CPA)
Cost Per Acquisition (CPA) measures the cost you incur to acquire one customer. It is calculated by dividing the total ad spend by the number of new customers gained through the campaign.
-
Why it's important: CPA allows you to determine the profitability of your campaigns. If the CPA is too high compared to the customer lifetime value (CLV), the campaign may need optimization.
-
Key Insight: If your CPA is lower than the average revenue generated by a new customer, you're likely running an efficient campaign.
4. Return on Ad Spend (ROAS)
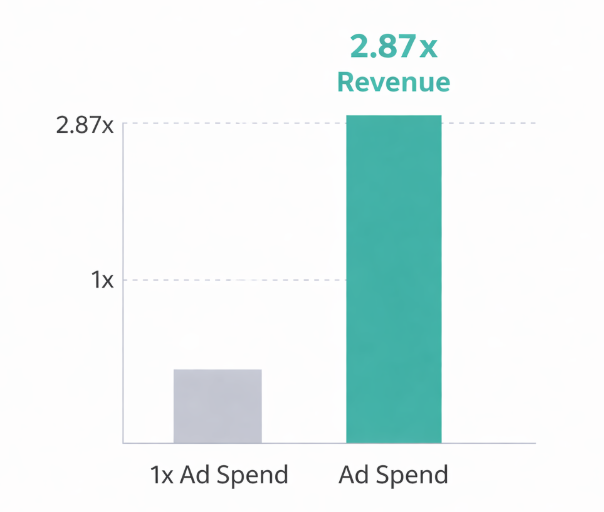
Average return on ad spend (ROAS) in ecommerce: advertisers receive nearly $2.87 in revenue for every $1 spent
Return on Ad Spend (ROAS) is a key metric for measuring the overall effectiveness of your advertising efforts. It compares the revenue generated from a campaign to the cost of running that campaign.
-
Why it's important: ROAS helps you gauge whether your ad spend is bringing in more revenue than it costs. A ROAS greater than 1 indicates a profitable campaign, with higher values representing better performance.
-
Target ROAS: Typically, a good target for ROAS is around 4:1, meaning for every $1 spent, you should aim to generate $4 in revenue.
5. Customer Lifetime Value (CLV)
Customer Lifetime Value is the predicted net profit generated from a customer over the entire relationship. It’s crucial for understanding the long-term value of your advertising efforts, beyond just immediate conversions.
-
Why it's important: Understanding CLV helps you make informed decisions about how much you should spend on customer acquisition and which channels are worth investing in for the long term.
-
Industry Average: On average, CLV can vary greatly depending on the industry, but businesses that focus on customer retention can see a CLV that is significantly higher than that of companies with one-time transactions.
6. Impression Share
Impression Share is the percentage of total available impressions that your ad has received compared to the total impressions it was eligible to receive. It is an important metric for gauging your visibility in the marketplace.
-
Why it's important: If your impression share is low, it indicates missed opportunities to show your ads. This could mean that your bids are too low or your budget is insufficient.
-
Actionable Insight: To increase impression share, consider adjusting your bid strategy or expanding your targeting options.
7. Ad Frequency
Ad Frequency refers to how many times a person sees your ad. Too high of a frequency can lead to ad fatigue, while too low of a frequency may not provide enough exposure.
-
Why it's important: Finding the right balance of frequency can help ensure your ads are effective without becoming repetitive or annoying. You want to optimize the number of times your audience sees the ad to encourage them to take action.
Advertising Metrics You Should Track to Optimize Campaign Performance
To predict the success of your advertising campaigns, tracking and analyzing these metrics consistently is key. These metrics help you determine where your ad spend is being allocated efficiently and where adjustments are necessary.
Useful Statistics:
-
According to WordStream, the average CTR across all industries is about 0.46% for display ads. Campaigns with higher CTR tend to be more effective in engaging the audience and achieving marketing goals.
-
A study by HubSpot found that businesses with a documented content marketing strategy have 13 times more chances of seeing positive ROI than those without.
Predictive Insights
These metrics allow marketers to predict not just current campaign success but also to make data-driven decisions that influence future ad strategies. By focusing on CTR, CPA, and ROAS, marketers can calculate their potential return and make necessary adjustments to their campaigns in real time.
Why Tracking Advertising Metrics Matters
Measuring performance is essential for optimizing campaigns. Predictive metrics help businesses allocate resources efficiently, prevent overspending, and continuously improve their marketing strategies.
For example, tracking the cost per acquisition and return on ad spend can help businesses determine if they need to shift their strategy toward more effective ad types or even refine the messaging to better resonate with their target audience.
Suggested Articles for Further Reading
Conclusion
Effective advertising hinges on understanding key performance metrics. From tracking click-through rates and conversion rates to measuring the return on ad spend and customer lifetime value, marketers must rely on data to drive decisions. By focusing on these critical metrics, businesses can predict the success of their campaigns and fine-tune their strategies to achieve superior outcomes.