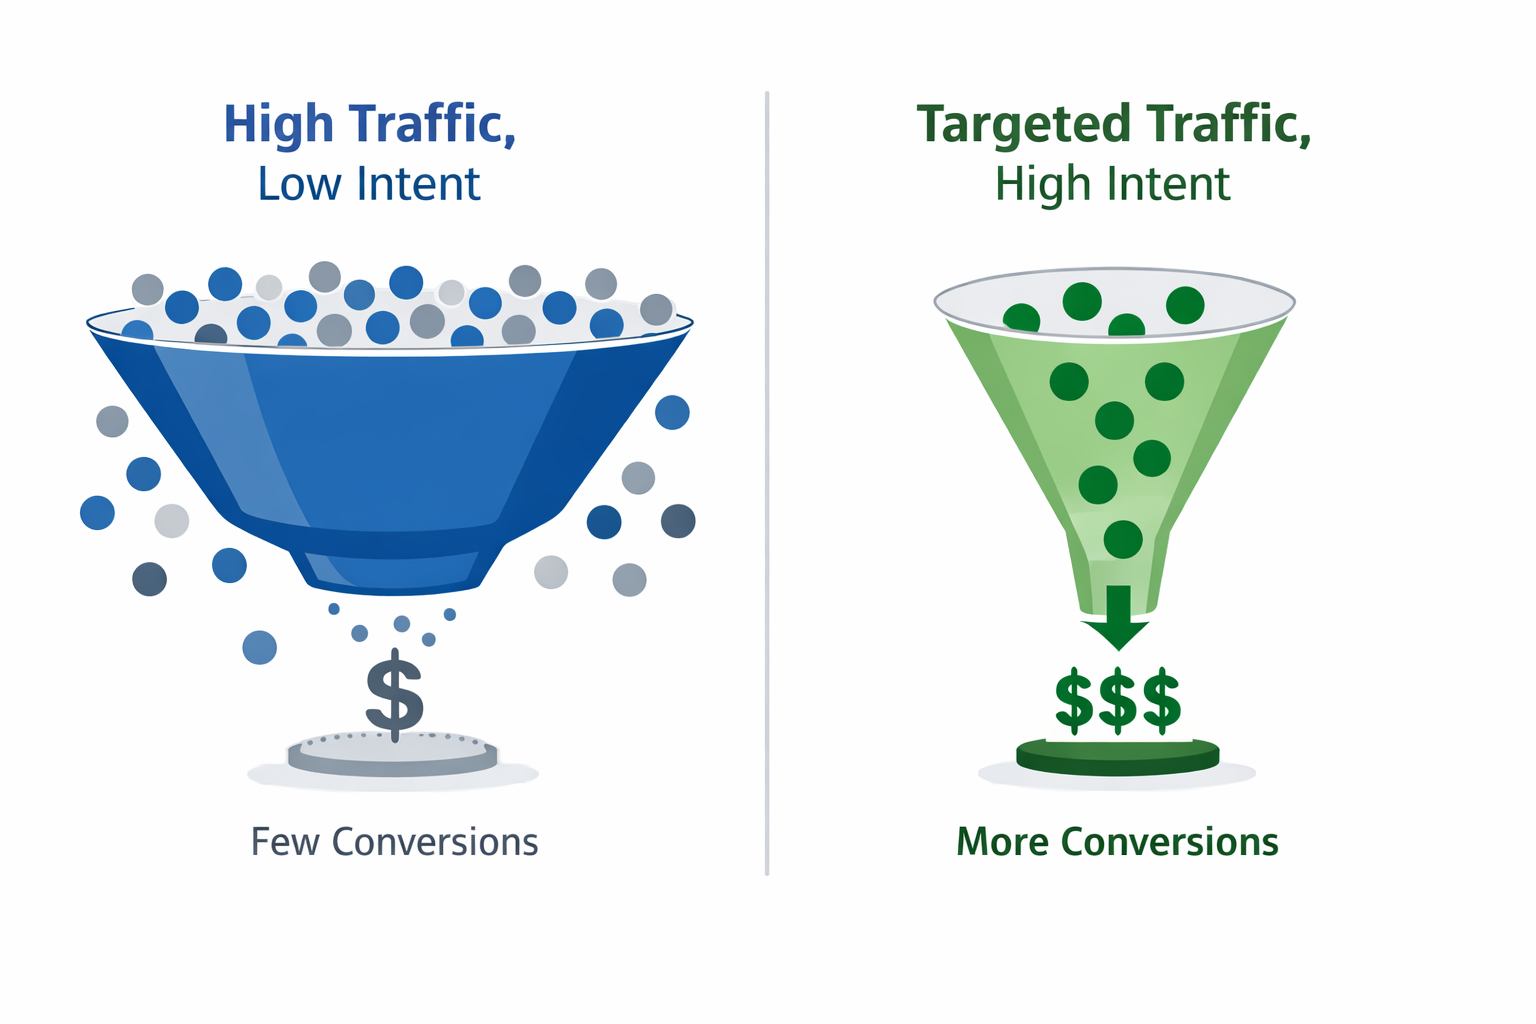
Running ads is easy. Running ads that reach the right people and turn into actual revenue? That’s a different game.
Many advertisers rely on basic metrics like reach, clicks, and CPM. But those numbers can be misleading. You might get a lot of traffic — but is that traffic buying, signing up, or even paying attention?
If you want to scale your Facebook and Instagram campaigns without wasting ad spend, you need to track audience quality. Not just activity — but intent, fit, and long-term value. This idea is explored further in Why Audience Quality Matters More Than Size for Facebook Ads.
Why Audience Quality Matters
Most paid campaigns fail quietly. They look fine on the surface — decent CTR, solid engagement — but underperform when it comes to real outcomes.
Focusing on quality over quantity helps you make smarter decisions. You can:
-
Allocate spend more efficiently, putting budget behind audiences that are likely to convert or engage further;
-
Improve creative performance, by learning what messaging works best with your highest-intent users;
-
Avoid wasted reach, especially when impressions are going to people who bounce or ignore your offer.
Let’s break down the key metrics that show whether your audience is actually worth the money you’re spending.
1. Landing Page Engagement
Clicks don’t mean much if people bounce right after landing.
This is often the first sign that your targeting or message needs work.
You should be tracking:
-
Bounce rate — this tells you the percentage of users who leave immediately after arriving. A high bounce rate usually means poor alignment between the ad and landing page.
-
Time on page — how long do people stay before clicking away? Under 10 seconds is often a red flag.
-
Pages per session — are visitors exploring beyond the first page? If not, they might not be interested or qualified.
If you’re getting cheap traffic but poor engagement, the issue is likely with your audience or ad promise. Either you’re targeting the wrong people or setting the wrong expectations.
For deeper analysis of what happens after the click, see How to Identify High-Quality Traffic Before Scaling.
2. Conversion Rate by Audience Segment
Overall conversion rate is too broad to be useful. Break it down by segment to find the real insights.
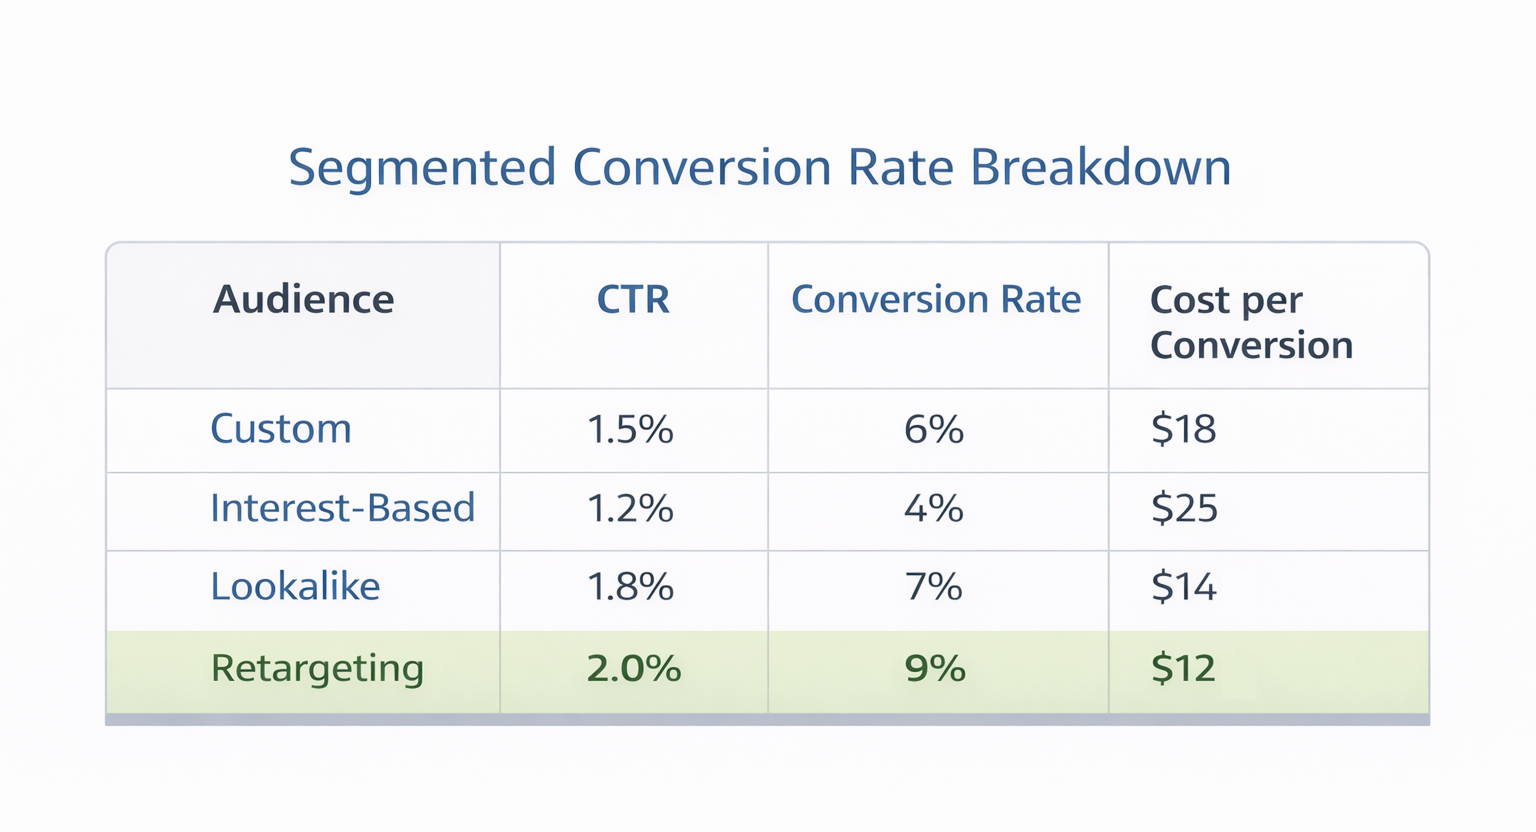
In this example, the retargeting audience shows the highest conversion rate and lowest cost — but the best-performing audience can vary based on offer, timing, and funnel stage.
Here’s how to segment your audience performance:
-
Custom audiences vs. interest-based — are past visitors, email subscribers, or existing leads converting better than new prospects?
-
Lookalike audiences vs. broad targeting — are algorithm-generated audiences actually outperforming general demographic or interest groups?
-
Cold vs. warm traffic — are your top-of-funnel audiences converting, or are only retargeted users taking action?
Tracking conversion rate by audience type shows where your real value is coming from. You may discover that 80% of your sales are coming from just 20% of your targeting.
Shift your spend accordingly. Don’t pay for clicks that don’t convert.
3. Lead Quality — Not Just Lead Volume
If you're generating leads, volume alone can be misleading.
Ten high-quality leads are often more valuable than 100 low-intent ones.
Here are signs of strong (or weak) lead quality:
-
Email validity — are users submitting real, usable contact info? Disposable or fake addresses are a clear signal of low intent.
-
Follow-up engagement — do they open your emails, reply to your outreach, or schedule a call? If not, they may just be clicking out of curiosity.
-
Qualification rate — do leads meet your business criteria (budget, location, industry, etc.)? If they don't qualify, they’ll waste your sales team’s time.
This topic is covered in more detail in How to Spot Low-Quality Leads Before They Hurt Your Funnel.
4. Lifetime Value (LTV) by Audience Source
Short-term ROAS is helpful, but it’s not the full picture.
Some users convert later, spend more, and come back again and again.
That’s why tracking LTV by audience matters. You should be looking at:
-
Total spend over time — do users from certain segments place larger or more frequent orders?
-
Repeat purchase behavior — are they buying again after the first conversion, or disappearing for good?
-
Subscription, upsell, or referral value — do they interact with multiple offers, refer others, or move to higher plans?
Optimizing for long-term value instead of first-click results makes scaling more predictable and more profitable.
5. Frequency and Engagement Over Time
Ad fatigue is real. If people keep seeing the same ad, they start ignoring it — or worse, hiding it.
To monitor fatigue, track:
-
Ad frequency — how many times has the average user seen your ad? A frequency above 3 often signals trouble for cold audiences.
-
CTR trend — is your click-through rate falling as frequency rises? That usually means your creative is wearing out.
-
Engagement drop — are likes, shares, or saves decreasing over time? If so, you’ve likely saturated the audience.
Small creative refreshes or expanded targeting can often solve this before performance drops too far.
6. Audience Overlap and Internal Competition
Sometimes, your ads are fighting each other for the same audience.
This drives up your costs and confuses the algorithm.
Here’s how to spot and fix it:
-
Use Meta’s Audience Overlap Tool — it shows how much overlap exists between two or more saved or custom audiences.
-
Watch for CPM spikes — if similar ad sets are live at the same time, your campaigns might be competing in the auction.
-
Consolidate or sequence ad sets — if overlap is high, merge audiences or run them at different times to avoid cannibalizing your own performance.
For a deeper breakdown, see The Role of Audience Overlap in Facebook Ads Performance.
7. Scroll Stop Ratio (a Quick Creative Quality Check)
Even great targeting fails if your creative doesn’t grab attention.
Scroll stop rate helps you quickly measure how well your ad captures interest in the feed.
Track:
-
3-second video views vs. impressions — how many people actually pause long enough to engage with your content?
-
Thumb-stop rate — a custom metric comparing quick views to actual interaction. Higher means better creative hooks.
This is especially useful when comparing visual formats — like Reels vs. Stories, or static images vs. carousels.
Final Thoughts — Track What Counts, Not Just What’s Visible
It’s tempting to focus on the numbers that look impressive.
High reach, strong CTR, and low CPM feel good. But they don’t always drive revenue.
Instead, pay closer attention to quality. The real indicators of success are often found after the click.
When you shift your focus to audience quality, your results improve — often without increasing budget.
FAQ: Smarter Targeting Starts Here
What is “audience quality” in social media ads?
It refers to how relevant, engaged, and likely to convert your audience is. A high-quality audience takes action — not just space.
Can I measure audience quality in Ads Manager?
Yes. Break down results by audience, look at conversion events, and integrate your CRM or analytics data for deeper insights.
How do I use this data to improve results?
Adjust your targeting, refresh your creative strategy, and prioritize segments that bring the highest value — even if they cost more upfront.