Creative performance benchmarks help marketers understand whether their ads are truly performing well or simply consuming budget. Without benchmarks, metrics like click-through rate or cost per conversion exist in isolation. With them, creatives can be evaluated against realistic performance ranges, enabling more confident scaling, testing, and optimization decisions.
This guide explains the most important creative benchmarks, how to interpret them correctly, and how to avoid the most common mistakes when using benchmark data.
What Are Creative Performance Benchmarks?
Creative performance benchmarks are reference metrics derived from aggregated advertising data across industries, platforms, and campaign objectives. They provide context for evaluating how an ad creative performs compared to a broader dataset rather than relying solely on internal averages.
Benchmarks are not targets. They are indicators that help identify underperformance, spot opportunities, and prioritize optimization efforts.
Core Creative Metrics and Their Benchmarks
Click-Through Rate (CTR)
CTR measures how compelling an ad is at first glance. Across paid social campaigns, average CTR typically falls between 0.9% and 1.6%, depending on industry and audience temperature.
Creatives consistently below 0.7% CTR often signal weak messaging, poor visual hierarchy, or low audience-message match. High-performing creatives usually exceed 1.8% CTR, especially in retargeting campaigns.
Cost Per Click (CPC)
CPC reflects how efficiently a creative captures attention in auction-based environments. On average, paid social CPCs range from $0.40 to $1.20.
When CPC increases while impressions remain stable, it often indicates creative fatigue rather than targeting issues. Refreshing visuals or changing the primary hook can reduce CPC by 15–30%.
Conversion Rate (CVR)
Creative influence on conversion rate is often underestimated. Industry data shows that ads with strong creative-message alignment convert 2–3× higher than generic creatives, even when driving traffic to the same landing page.
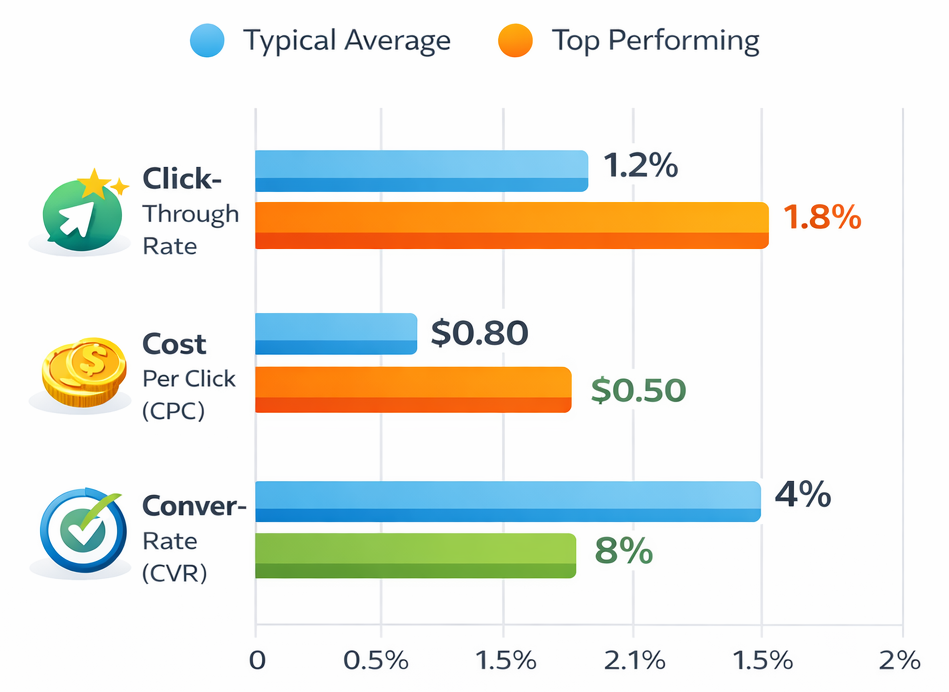
Average vs. Top Creative Performance Benchmarks Across Key Paid Media Metrics
For most paid social campaigns, conversion rates between 3% and 6% are considered healthy, while top-performing creatives can exceed 8%.
Cost Per Acquisition (CPA)
CPA is the ultimate outcome metric. Benchmarks vary widely by industry, but creative quality alone can influence CPA by up to 40%, independent of bidding or targeting adjustments.
When CPA rises gradually over time, the cause is frequently creative saturation rather than funnel issues.
Why Benchmarks Should Be Used Carefully
Benchmarks are most effective when used as directional signals, not rigid rules. A creative performing below benchmark in one account may still be profitable depending on lifetime value or downstream conversions.
Common benchmark mistakes include:
-
Comparing cold traffic benchmarks to retargeting campaigns
-
Applying industry averages without considering audience intent
-
Optimizing solely for CTR while ignoring conversion quality
Benchmarks should inform testing priorities, not replace structured experimentation.
Creative Fatigue and Benchmark Decay
One often overlooked factor is benchmark decay. As audiences see the same creative multiple times, performance naturally declines.
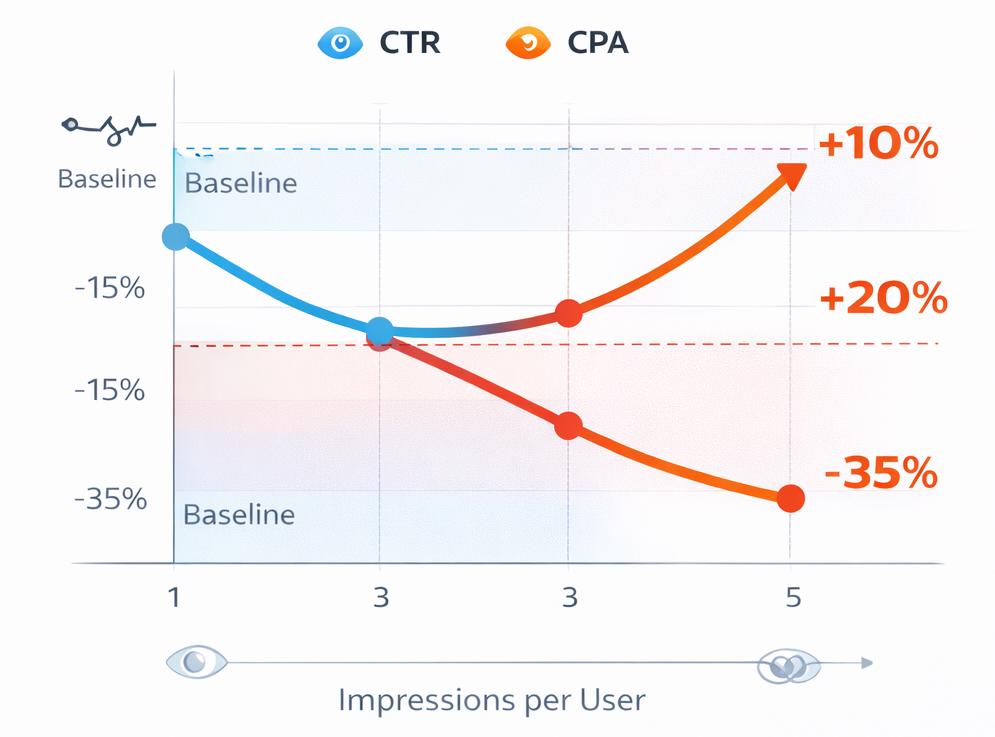
Trend of Click-Through Rate and Cost Per Acquisition as Creative Impressions Increase
Data shows that after 3–5 impressions per user, CTR typically drops by 25–40%, and CPA can increase by 20% or more. Monitoring benchmarks over time helps identify when a creative needs refreshing before performance drops significantly.
Using Benchmarks to Improve Creative Testing
Effective creative testing starts with benchmarks as a baseline. Instead of testing randomly, use benchmarks to define what success looks like:
-
Test new creatives against a benchmark-based control
-
Pause creatives that fall 30% below baseline after sufficient spend
-
Scale creatives that outperform benchmarks for 7–10 consecutive days
This approach reduces guesswork and ensures testing decisions are data-driven.
Key Takeaways
Creative performance benchmarks provide essential context for evaluating ad effectiveness. When used correctly, they help identify fatigue, prioritize testing, and improve overall efficiency. When used incorrectly, they can lead to premature optimization or missed growth opportunities.
The most successful advertisers treat benchmarks as dynamic reference points—adjusting expectations based on audience type, campaign stage, and creative lifecycle.