Most advertisers try to predict performance using platform estimates or recent results. That approach breaks down quickly once spend increases or conditions shift.
Reliable forecasting doesn’t come from projections inside Ads Manager. It comes from understanding how your own historical data behaves under different constraints — budget, audience pressure, and conversion volume.
If you’ve run enough campaigns, the signals are already there. The challenge is reading them correctly.
Why Platform Forecasts Break Down in Real Campaigns
You’ve likely seen this: Ads Manager predicts stable CPL at higher spend, but once you scale, costs rise and lead quality drops.
This happens because platform forecasts assume static auction conditions and linear scaling, which rarely exist in practice.
In reality:
-
Auction competition changes daily — new advertisers enter the same audience pools, pushing CPM higher even if your setup stays unchanged.
-
Audience saturation builds faster than expected — frequency increases accelerate once you push budget into the same segments.
-
Conversion signals weaken at scale — the algorithm expands into lower-intent users, which reduces downstream efficiency.
If you’ve ever wondered why performance becomes unstable when scaling, the mechanics are explained in detail in and in practical terms in What to Do When Facebook Ads Stop Scaling Beyond a Certain Point.
What Historical Data Actually Reveals
Most teams treat past results as reports. In reality, they are behavioral records of how the system reacted under specific conditions.
Historical data allows you to see:
-
Where performance stayed stable — your true baseline zone
-
Where costs started increasing — your pressure threshold
-
How quality changed with volume — your scaling tradeoff
For example:
-
When budget increased from €2k/day to €5k/day, CPL may have remained flat for a few days before jumping 40%.
-
Frequency rising above ~2.3 may have coincided with a noticeable drop in conversion rate.
-
Lead acceptance rate may have declined as targeting broadened.
These patterns are not theoretical — they’re directly visible in your account and align with how performance ceilings are discussed in How to Identify When a Facebook Campaign Has Hit Its Performance Ceiling.
Identifying Your Scaling Thresholds
Every account has a point where performance stops scaling efficiently. The key is to identify it before you cross it.
You can extract this from historical data by mapping relationships:
-
Spend vs CPL inflection point
Plot daily spend against CPL. A sharp increase signals that you’ve exceeded efficient auction reach. -
Frequency vs CVR decline
When frequency climbs and conversion rate drops, you’re seeing audience fatigue — not random fluctuation. -
Volume vs lead quality drop-off
Increased lead volume often comes from weaker intent segments. If CRM data shows declining acceptance rates, the system is expanding too aggressively.
These signals are measurable and should be treated as operational constraints, not anomalies.
Building a Practical Forecast Model
You don’t need complex modeling to forecast effectively. A structured baseline with realistic adjustments is often more reliable.
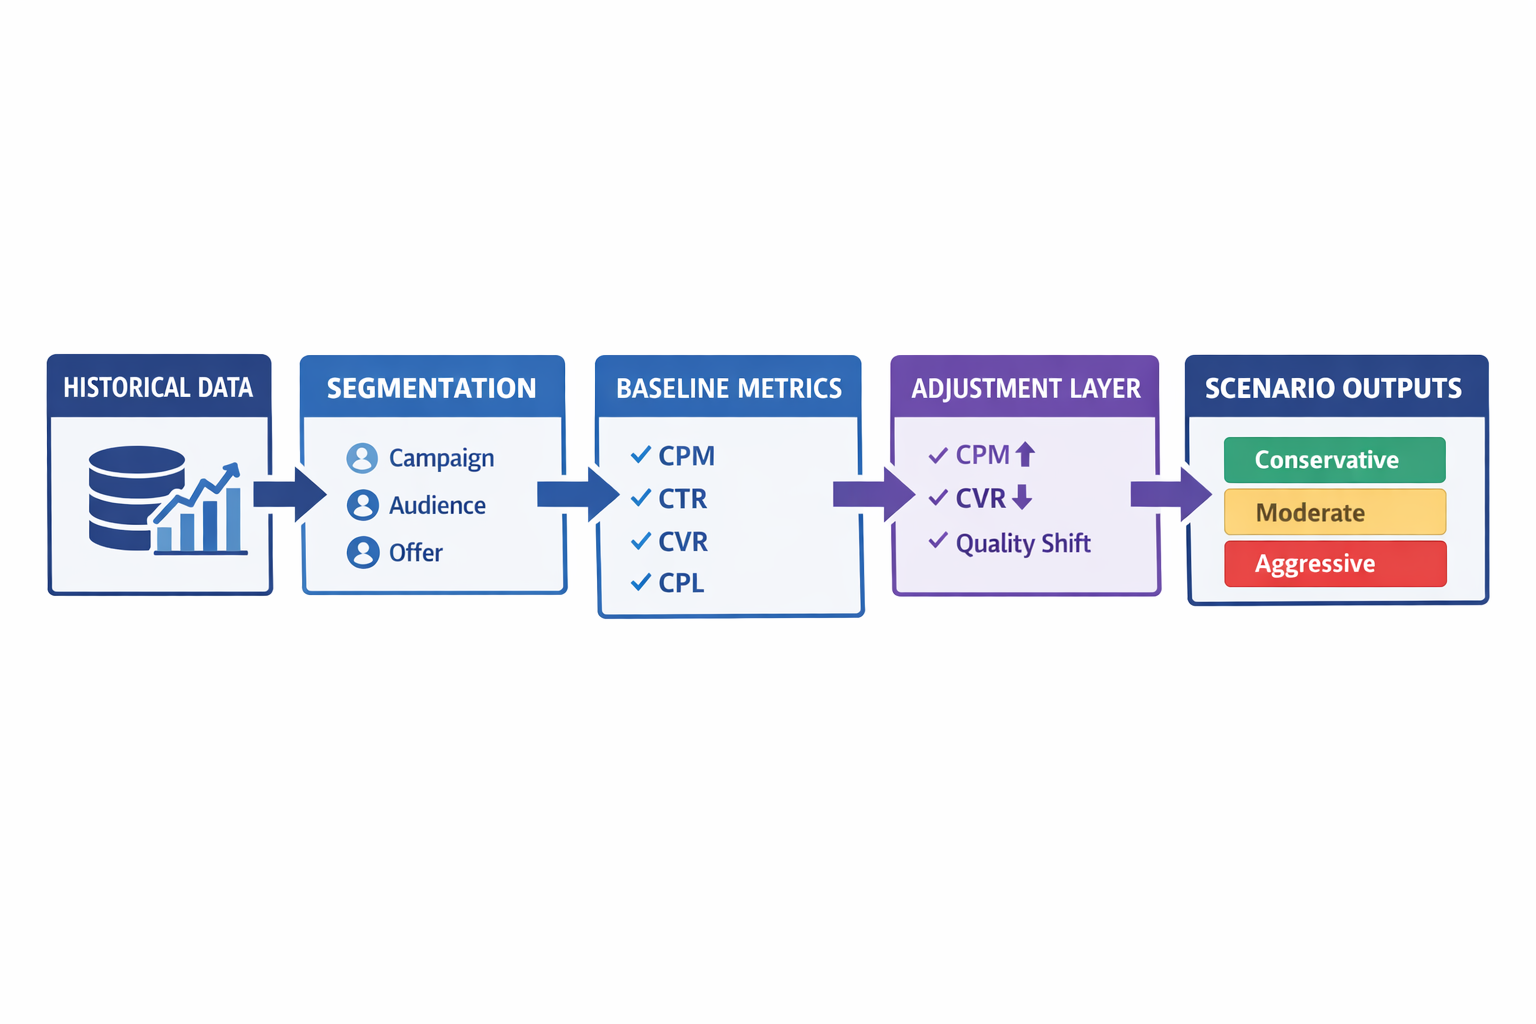
A workable process:
-
Define a stable baseline window
Choose a period where metrics were consistent — no major creative changes, stable targeting, predictable costs. -
Extract core performance metrics
Focus on:-
CPM (cost to enter auctions)
-
CTR (ad engagement signal)
-
CVR (conversion efficiency)
-
CPL (cost outcome)
-
Lead quality metrics (acceptance, qualification)
-
-
Apply degradation based on historical patterns
Instead of assuming stability:-
Increase CPM as spend enters more competitive auctions
-
Reduce CVR as audience broadens
-
Adjust lead quality as volume increases
-
-
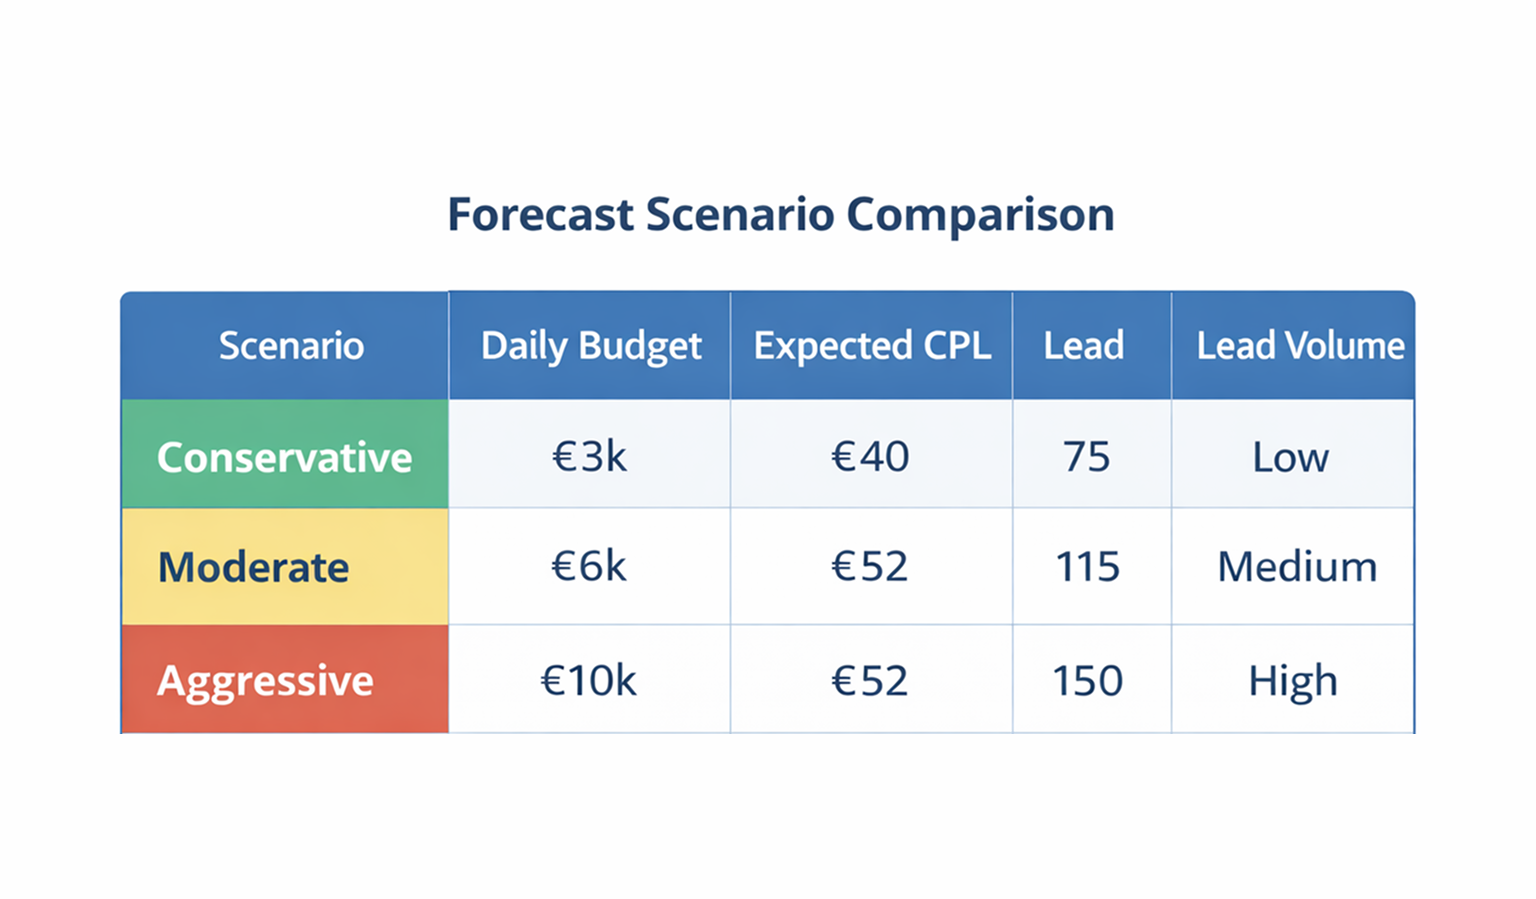
Create multiple scenarios instead of one forecast
Build:-
Conservative case — minimal scaling, stable efficiency
-
Moderate case — controlled expansion with manageable decay
-
Aggressive case — higher spend with clear efficiency loss
-
This approach reflects reality far better than a single-point prediction.
The Role of Conversion Lag in Forecasting
One of the biggest sources of error is ignoring delayed conversions.
If your sales cycle extends beyond a few days, recent data will underreport performance.
This is especially critical in lead generation and B2B campaigns.
You can correct for this by analyzing conversion timing:
-
Measure how long it takes users to convert after clicking or viewing an ad
-
Break down conversions by time intervals (1 day, 3 days, 7 days, etc.)
For example:
-
60% of conversions happen within 2 days
-
30% occur between day 3–7
-
10% come later
If you evaluate campaigns too early, you’ll underestimate results and make incorrect scaling decisions.
A deeper breakdown of this mechanism is covered in What Conversion Lag Means for Your Facebook Ads.
When Historical Data Becomes Misleading
Not all past data should be used for forecasting. Some of it reflects conditions that no longer apply.
You should exclude periods where:
-
Tracking was unreliable — attribution gaps distort results
-
Offer or creative changed significantly — performance is not comparable
-
Audience strategy shifted — broad vs narrow targeting behaves differently
Instead of averaging everything, segment your data by:
-
Campaign objective
-
Audience type
-
Funnel stage
-
Offer structure
This prevents false conclusions and aligns with how performance analysis should go beyond surface metrics, as explained in How to Analyze Facebook Ad Performance Beyond CTR and CPC.
Using Forecasting as a Decision Tool, Not a Prediction
Forecasting shouldn’t be treated as a way to “predict results.” It’s a tool for evaluating tradeoffs before committing budget.
For example:
-
If scaling to €10k/day increases CPL by 35%, the real decision is whether the additional volume is still profitable.
-
If lead quality drops below sales capacity thresholds, scaling may create operational issues even if volume increases.
Forecasting gives you a controlled way to anticipate these outcomes instead of reacting after performance declines.
Practical Takeaway
Accurate forecasting comes from understanding how your campaigns behave under pressure — not from platform estimates.
If you extract:
-
your scaling thresholds,
-
your efficiency decay patterns,
-
and your conversion timing,
you can build forecasts that reflect real performance dynamics.
That’s what allows you to scale with intent instead of relying on assumptions.