
Most marketing reporting answers the easiest question: “What got credit?”
Revenue decisions need a harder answer: “What caused additional purchases that wouldn’t have happened otherwise?”
Attribution dashboards, platform ROAS, and last-click reports are useful for directional monitoring, but they can reward the wrong actions: chasing already-intent customers, over-valuing retargeting, and under-funding awareness that creates future demand. The goal of measurement is not perfect credit assignment. It’s to reliably tell you where the next dollar will produce incremental profit.
Start With the Only Definition That Matters: Incremental Profit
A channel “moves revenue” only if it creates incremental outcomes:
-
Incremental revenue: additional revenue caused by marketing, beyond what would happen organically.
-
Incremental profit: incremental revenue minus variable costs (COGS, shipping subsidies, discounts, payment fees, returns, support load, and ad spend).
If you optimize for attributed revenue, you risk paying for customers who would have converted anyway. If you optimize for incremental profit, you can scale with confidence—even when attribution is messy.
A simple way to reframe performance
Instead of “ROAS,” use Contribution Margin ROAS (CM-ROAS):
-
Contribution Margin = Revenue − COGS − variable costs − discounts/returns
-
CM-ROAS = Contribution Margin ÷ Ad Spend
This automatically discourages low-quality volume and pushes budget toward revenue that actually helps the business.
Why Traditional Attribution Often Misleads

47% of marketers report difficulty with multi-touch attribution, highlighting major challenges in tracking the real drivers of revenue
Attribution is a crediting system, not a causal proof system. It can be wrong even when tracking is “perfect.”
1) Double-counting makes results look better than reality
A common pattern:
-
Platform A reports 100 purchases
-
Platform B reports 80 purchases
-
Your backend shows 120 total purchases
That implies 60 purchases are being “claimed” twice. In this scenario:
-
Total claimed purchases = 180
-
Real purchases = 120
-
Attribution inflation = (180 − 120) ÷ 120 = 50%
Inflation is not a tracking bug; it’s how multi-touch ecosystems work when every platform measures from its own viewpoint.
2) Last-click can reward the “closest touch,” not the “most important touch”
Discount codes, branded search, and retargeting often appear right before purchase. That doesn’t mean they created demand—it may mean they captured demand created elsewhere.
3) Correlation gets mistaken for causation
When you increase spend, conversions may rise at the same time—especially during seasonality or promotions. Without a counterfactual (what would have happened without the spend), it’s easy to overestimate impact.
Build a Measurement Stack That Separates Monitoring From Proof
Use different tools for different truths:
Layer A: Monitoring (fast feedback, not causal)
Use for daily decisions:
-
Spend pacing
-
CTR/CVR trends
-
CPA and blended CAC
-
Funnel health (add-to-cart rate, lead-to-MQL rate, etc.)
-
Creative and audience comparisons within the same channel
Layer B: Attribution (directional credit)
Use for:
-
Diagnosing where journeys tend to start or finish
-
Finding assisting campaigns
-
Comparing creatives/ad sets when everything else is stable
Layer C: Incrementality (causal proof)
Use for:
-
Budget scaling decisions
-
Upper-funnel evaluation
-
“Should we keep funding this?” questions
Layer D: Revenue modeling (strategic allocation)
Use for:
-
Cross-channel allocation
-
Seasonality effects
-
Long-term vs short-term tradeoffs
The mistake is expecting Layer A or B to do Layer C’s job.
What to Measure Weekly If You Want Revenue Truth
Here are the core metrics that keep teams aligned:
-
Incremental Contribution Margin (by channel and overall)
-
Blended CM-ROAS (total contribution margin ÷ total spend)
-
Payback period (days/weeks to recover CAC from contribution margin)
-
New-customer share (what % of orders are truly new)
-
Repeat rate / cohort LTV (revenue and margin over time by acquisition month)
If you can’t tie marketing to margin and payback, “growth” can quietly become expensive churn.
How to Prove Impact With Incrementality Testing
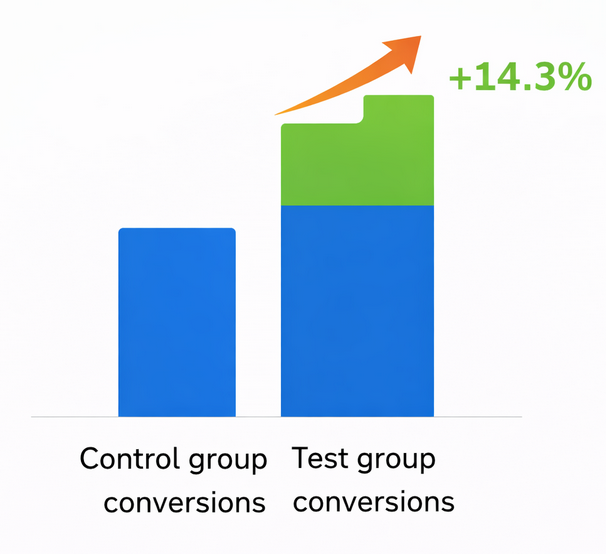
Example incrementality result: a 14.3% lift in conversions over the control group, showing the true impact of an ad campaign when measured causally
Incrementality answers: What changed because we advertised?
The gold standard: Holdout tests
Create a test group that gets ads and a control group that doesn’t (or gets reduced exposure). Then compare outcomes.
Common approaches:
-
Geo holdouts: test vs control regions
-
Audience holdouts: a percentage of users excluded from ads
-
Time-based tests: alternating on/off periods (use carefully due to seasonality)
What “good” looks like (example)
-
Control revenue: €100,000
-
Test revenue: €112,000
-
Incremental lift = (112,000 − 100,000) ÷ 100,000 = 12%
Now translate lift into profit:
-
Incremental revenue: €12,000
-
Gross margin: 60% → €7,200
-
Variable costs/returns: €1,200
-
Ad spend: €3,000
-
Incremental profit: €7,200 − €1,200 − €3,000 = €3,000
That’s a real business outcome you can defend in a budget meeting.
How often to test
-
Run structured incrementality tests quarterly for major channels.
-
Keep always-on holdouts where feasible (small, persistent control groups) to detect drift.
-
Re-test when you change any of these: targeting approach, creative strategy, offer depth, landing experience, or budget level.
Calibrate Attribution With Experiments (Instead of Replacing It)
You don’t need to abandon attribution—just stop treating it as truth.
Use incrementality tests to create a calibration factor.
Example:
-
Attribution shows €100k in revenue from a channel
-
Incrementality test shows only €60k would disappear without it
-
Calibration factor = 0.6
Now your reporting can show both:
-
Attributed revenue: €100k (monitoring)
-
Estimated incremental revenue: €60k (planning and scaling)
This helps teams stop arguing about whose dashboard is “right” and start agreeing on what to do next.
Bring Offline and Post-Purchase Revenue Into the Picture
If your business has offline conversion events or delayed revenue, attribution alone will undercount value.
Make sure your measurement includes:
-
Qualified leads → closed-won revenue
-
First order → repeat orders (cohort tracking)
-
Refunds/returns and discount impact
-
Subscription retention and expansion (if relevant)
A practical rule: if a purchase decision takes longer than a week, you need cohort-based reporting—not just daily ROAS.
When Marketing “Works” but Revenue Doesn’t: The Four Diagnostic Checks
If spend and platform metrics look good but finance says revenue is flat, run these checks:
1) New vs returning mix
Are you buying customers who already know you?
If returning share rises while new-customer contribution stalls, you’re likely over-investing in demand capture.
2) Offer dependency
Is performance driven by deeper discounts?
Check contribution margin, not just conversion rate.
3) Channel cannibalization
Did one channel’s “growth” come from another channel’s decline?
Look at blended outcomes and test incrementality.
4) Saturation and diminishing returns
As spend increases, incremental gains often slow.
Plot spend vs incremental profit by week/month to find the point where scaling stops being efficient.
A Practical Revenue Measurement Workflow (That Teams Actually Follow)
Step 1: Define one revenue KPI and one efficiency KPI
-
Revenue KPI: Incremental contribution margin
-
Efficiency KPI: Payback period or incremental profit per €1,000 spent
Step 2: Set a clear attribution policy
Document what you will and won’t use attribution for:
-
Yes: creative testing within a channel, directional trends
-
No: proving incremental value, cross-channel budget wars
Step 3: Build a weekly scorecard
Include:
-
Blended revenue and blended CM
-
Spend by channel
-
New customer count and share
-
Payback and refund rate
-
Notes on promos/seasonality/product changes
Step 4: Run incrementality tests on a schedule
-
Pick the biggest budget line items first
-
Test at realistic spend levels
-
Use confidence intervals and minimum detectable effect planning (avoid tests too small to learn from)
Step 5: Make budgeting a rules-based process
Examples of rules that prevent emotional decisions:
-
“Increase spend 10–20% only if incremental profit remains positive for 2 consecutive weeks.”
-
“Upper-funnel budget is protected unless incrementality shows negative profit in two separate tests.”
-
“Retargeting spend caps at X% of total unless new-customer share improves.”
Common Pitfalls (And How to Avoid Them)
-
Pitfall: Using platform lift studies as your only proof
Fix: validate with your own holdouts and backend margin data. -
Pitfall: Measuring success on short windows only
Fix: use cohorts (30/60/90-day contribution margin) for channels that create future demand. -
Pitfall: Testing too many things at once
Fix: isolate variables—test one major change per cycle (offer, audience strategy, creative angle, landing experience). -
Pitfall: Optimizing for efficiency until growth dies
Fix: maintain a balanced portfolio: proven demand capture + tested demand creation.
Closing: The Measurement Mindset That Scales
Revenue measurement becomes easier when everyone agrees on one principle:
Marketing performance is not what the dashboard credits—it’s what the business would lose if you turned marketing off.
Use attribution for speed, experiments for truth, and margin-based metrics for alignment. When you do, budget conversations shift from opinions to evidence—and scaling becomes a disciplined financial decision instead of a leap of faith.