If you’re running ads on social platforms like Facebook, Instagram, TikTok, or LinkedIn, you’ve probably asked yourself:
Are these ads actually working?
The only way to answer that with confidence is to know what your numbers are telling you. Paid social metrics aren’t just there for reporting. They’re your roadmap to better results — helping you spot what’s working, fix what’s not, and grow with more control.
But not all metrics are created equal. Some matter more than others, depending on your goals. This guide will walk you through the most important ones — and show you how to use them the right way.
Why Metrics Matter in Paid Social
Every click, view, and conversion tells a part of the story. The trick is knowing which parts to pay attention to — and how to connect them.
Here’s what smart tracking helps you do:
• Spot gaps in your funnel that are killing performance;
• Compare creative, audiences, and platforms with real numbers;
• Test ideas faster — and with more confidence;
• Scale winning campaigns without wasting budget.
Too often, advertisers get distracted by surface numbers. But if you focus on the right metrics and keep them in context, you’ll make better decisions — and get better returns.
For a deeper dive into interpreting metrics the right way, check out how to analyze Facebook ad performance beyond CTR and CPC.
Performance Metrics: Is Your Ad Getting Attention?
These are the basics. They help you understand how your ads are showing up and whether people are even noticing them.
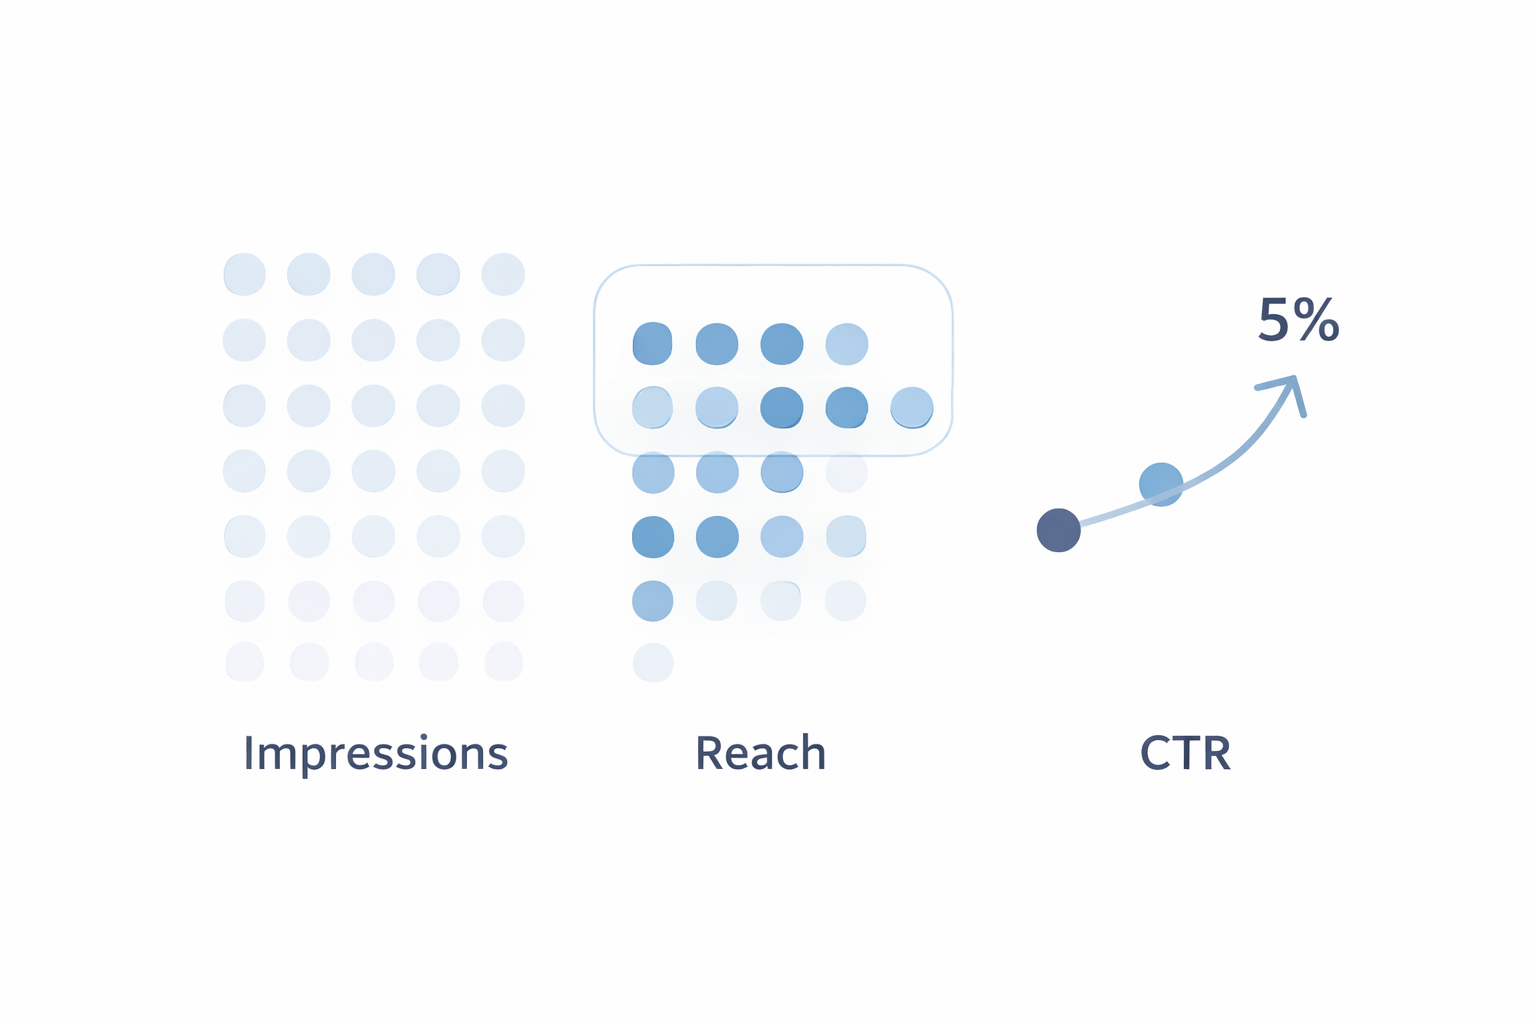 The large bar with dots shows all Impressions, while the smaller Reach bar inside shows unique viewers. CTR is shown as a percentage of Reach, showing that clicks depend on actual people reached — not total views.
Impressions
This is how many times your ad was displayed. If one person sees your ad five times, that’s five impressions.
Use it to:
• Measure how widely your ad is being delivered;
• Compare placements (Feed vs. Stories, for example);
• Spot delivery issues early (low impressions = limited reach or budget).
Example: If you’ve launched a new campaign and it’s only getting a few hundred impressions, something’s off — maybe your budget is too low or your audience too narrow.
Need clarity? Here’s what ad impressions really mean — and how to use them.
Reach
This tells you how many unique people saw your ad. Unlike impressions, each person is only counted once.
Use it to:
• Make sure you’re reaching fresh eyes — not the same people over and over;
• Track audience growth over time;
• Avoid ad fatigue (more on that later).
Example: High impressions but low reach? You’re probably showing the ad too many times to too few people.
Learn more about the difference between reach and impressions and how each impacts your strategy.
Click-Through Rate (CTR)
This shows how many people clicked on your ad after seeing it. It’s one of the best early signals of how effective your creative and message are.
Use it to:
• Test headlines, images, and offers;
• Spot creative fatigue (a sudden drop in CTR);
• Compare different audiences or placements.
Example: A 4% CTR on one ad and 0.9% on another? The first one is clearly pulling more attention — but you still need to check what happens after the click.
Want to know if your CTR is healthy? Here’s a breakdown of average Facebook CTR benchmarks by campaign type.
Engagement Metrics: Are People Actually Interested?
It’s one thing to get views and clicks. It’s another to get real interaction. These metrics show if your ad is getting people to respond in some way — which matters, especially for top-of-funnel or brand campaigns.
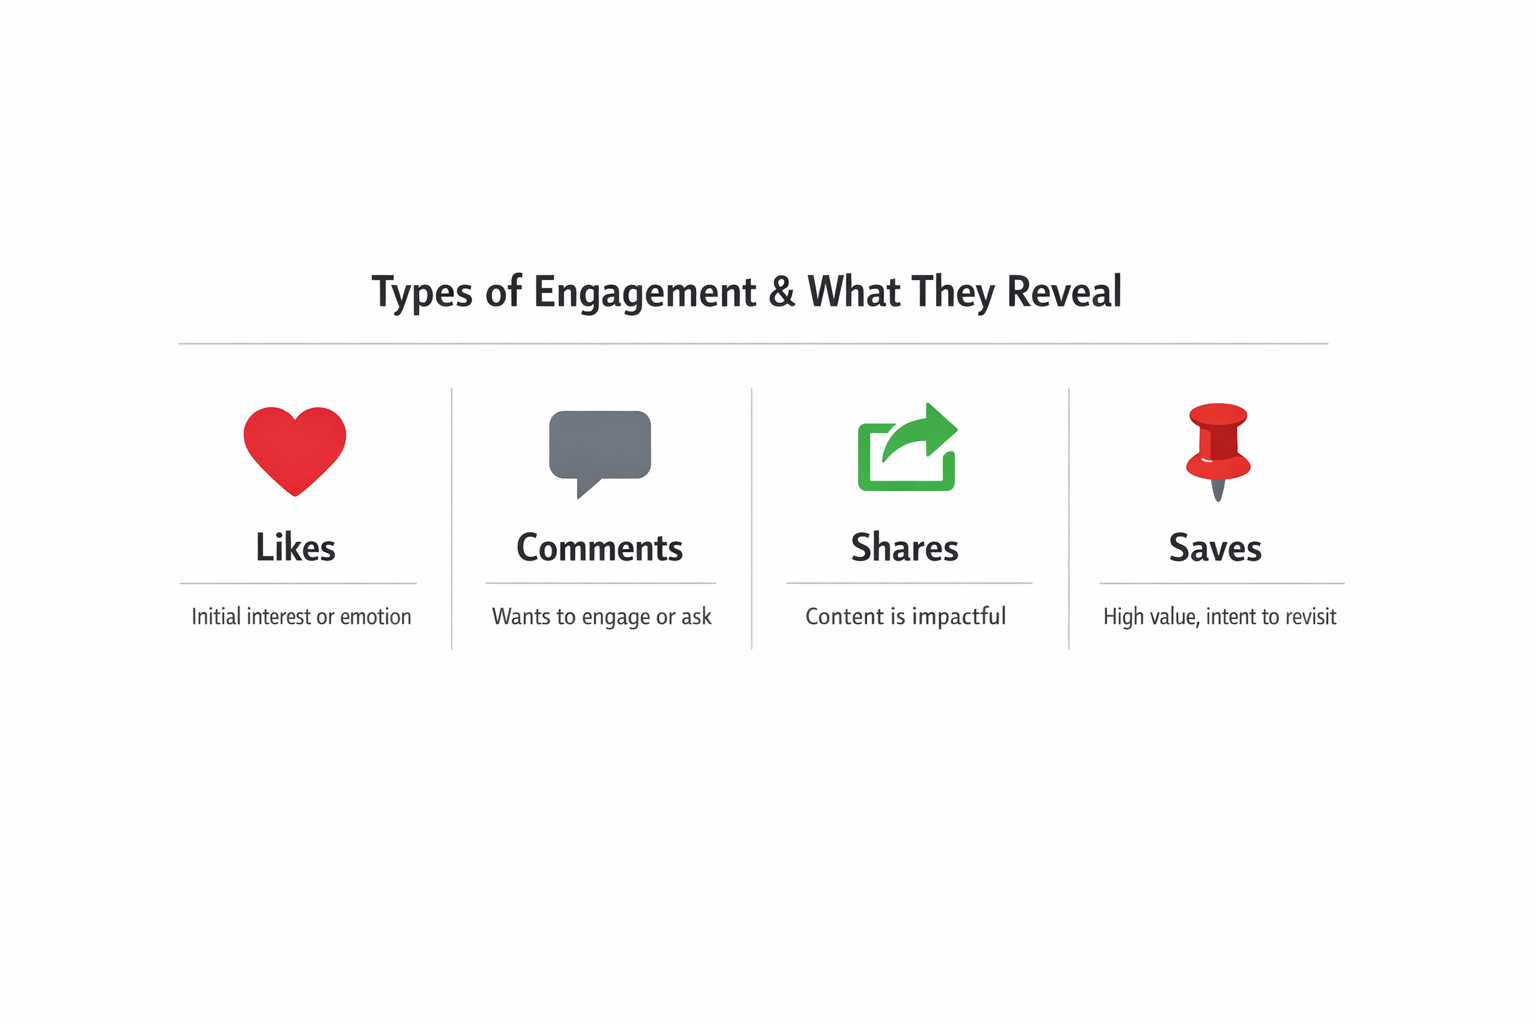
Likes, Comments, Shares
These are basic reactions, but they can give you great signals about how your message is landing.
Use them to:
• See which creative styles spark attention or emotion;
• Understand what people care about (from their comments);
• Boost reach — shares can expand your visibility for free.
Example: If a video ad is getting lots of shares but low clicks, it might be entertaining but not clear about the next step. Time to sharpen the call to action.
Why tracking engagement metrics is crucial — even when your goal isn’t direct conversion.
Saves (especially on Instagram)
Saves mean someone found your content valuable enough to come back to it later. That’s often a strong sign of intent.
Use saves to:
• Measure interest in product collections, tutorials, or downloads;
• Identify mid-funnel interest (users not ready to buy but thinking about it);
• Prioritize retargeting to users who saved but didn’t click.
Example: A carousel ad for your product line gets more saves than clicks? That’s a cue to follow up with a stronger offer or reminder ad.
Conversion Metrics: Are People Taking Action?
Now we’re getting to the numbers that really matter for your bottom line — actions like purchases, signups, downloads, or leads. These metrics show whether your campaigns are actually doing their job.
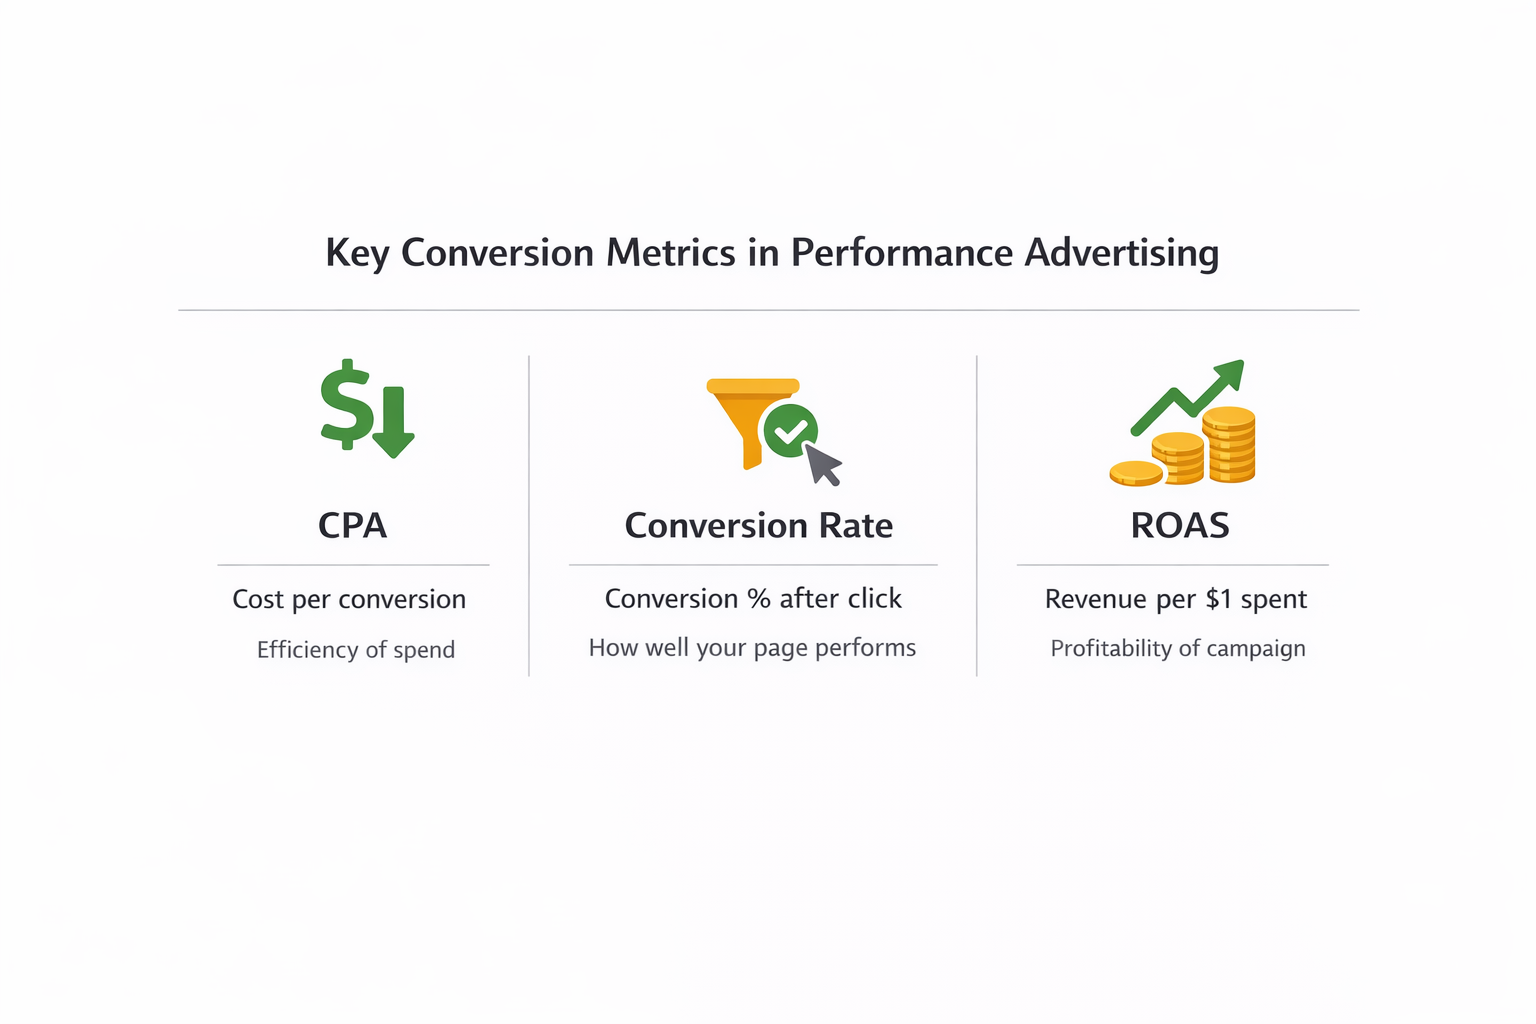
Cost Per Action (CPA)
This is the average cost to get one conversion — like a purchase, lead, or free trial.
Use CPA to:
• Compare how efficiently different ad sets, creatives, or audiences are performing;
• Decide where to spend more or less;
• Monitor when performance starts to slip.
Example: If one audience costs $20 per lead and another costs $65, you know where your money works harder — assuming lead quality is the same.
If you’re struggling with high CPA, check these common mistakes and how to fix them.
Conversion Rate
This tells you the percentage of people who completed the action after clicking your ad.
Use conversion rate to:
• Evaluate your landing page or offer;
• Spot friction points (slow loading, unclear messaging, etc.);
• Prioritize fixes when you have good traffic but poor results.
Example: High clicks, low conversions? The problem isn’t the ad — it’s what happens after the click.
Looking to boost conversion rate? Try these 8 proven tactics to improve results.
Return on Ad Spend (ROAS)
ROAS tells you how much revenue your ads generate for every dollar spent. If you spend $500 and make $1,500, your ROAS is 3.0.
Use ROAS to:
• Measure profitability at the campaign or product level;
• Set targets for scaling;
• Compare performance across platforms or markets.
Example: If your retargeting ad is getting a ROAS of 6.0, it’s bringing in $6 for every $1 spent — that’s a campaign worth increasing budget on.
Want to know how to improve ROAS further? Read these advanced ROAS improvement strategies.
Delivery + Audience Health: Is Your Ad Still Performing?
These numbers help you monitor how your ad is being received 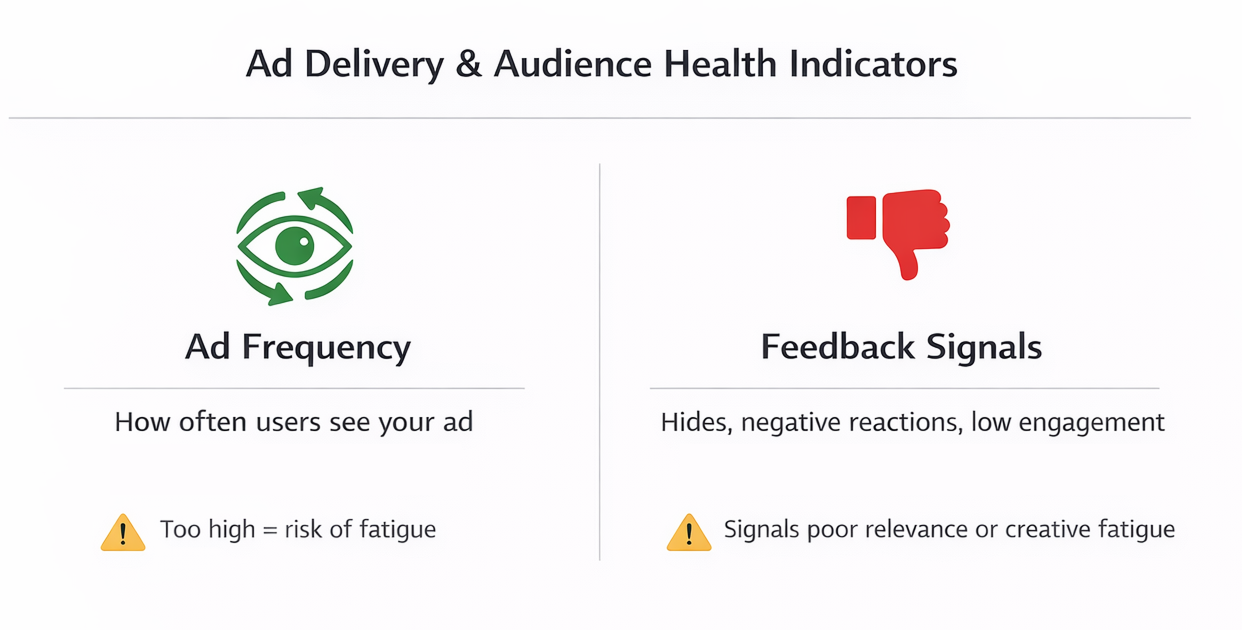 and if it’s still doing its job over time.
Frequency
This tells you how many times, on average, someone has seen your ad.
Use frequency to:
• Avoid overexposing the same users;
• Spot signs of ad fatigue (rising cost, lower clicks);
• Time your creative refreshes.
Example: If your frequency hits 6+ and CTR drops, your audience is likely tuning out. Time to test new visuals or copy.
Need help managing frequency and performance? Here’s how to avoid ad fatigue and spot early signals.
Feedback and Quality Metrics
Some platforms provide quality scores based on user reactions — things like hides, negative comments, or low engagement.
Use these to:
• Identify when your creative is getting ignored or rejected;
• Spot early warning signs before performance tanks;
• Keep your audience experience clean and relevant.
Example: If your ad is getting “hidden” often, something’s off — maybe it’s repetitive, unclear, or targeting the wrong group.
How to Use These Metrics Together
The real insights happen when you connect the dots.
Let’s say:
• High CTR + Low Conversions = landing page or offer mismatch;
• High Impressions + Low CTR = weak creative or bad audience fit;
• High Saves + Low Clicks = interest without urgency (consider retargeting or changing the CTA).
Create weekly performance snapshots. Track only the metrics that match your goal. And always test one change at a time — so you know what made the difference.
Here’s a great guide on which Facebook metrics really matter when testing new audiences.
Final Thoughts
The best advertisers aren’t the ones who chase cheap clicks or one-off wins. They’re the ones who know how to read the numbers — and use them to make better choices every week.
To wrap it up, here’s how to use your metrics well:
• Start with clear goals (awareness, leads, sales);
• Focus on a handful of metrics that support that goal;
• Don’t panic over daily shifts — look at trends over 3–7 days;
• Use what you learn to shape your next test, not just explain the last result.
When you understand your numbers, you stop guessing. And when you stop guessing, your campaigns get stronger, smarter, and more profitable.