Running both Google and Facebook ads is common. Measuring them the same way is a mistake.
On Google, people search because they already want something. On Facebook or Instagram, people scroll without a clear goal. Your ad appears while they are focused on something else.
That difference affects how people click, how they convert, and how long it takes to see results. It also changes which metrics are useful and which ones can be misleading.
What’s Different About Search and Social
Think about how intent shows up in each channel.
On Google, someone types “buy running shoes for flat feet.” That person is close to a decision. On Instagram, someone might see a running shoe ad while browsing travel photos. They were not planning to buy anything, but the ad caught their attention.
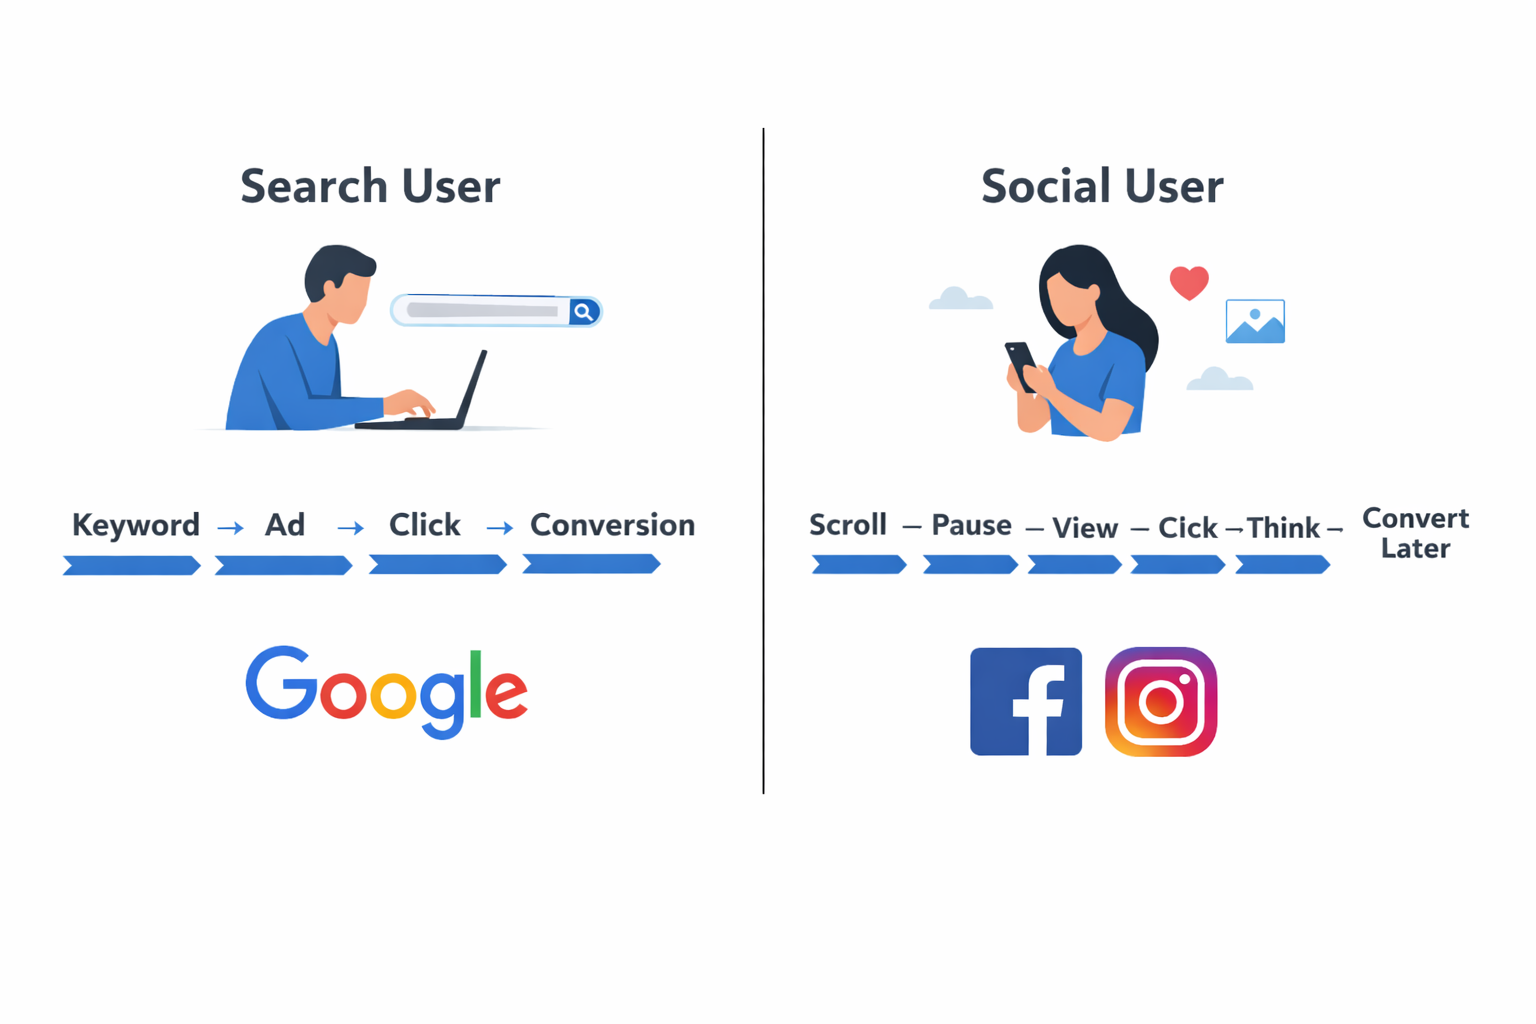
In search, ads respond to demand. In paid social, ads help create it.
This difference in intent is why clicks, conversions, and ROAS behave so differently across platforms. If you want a deeper breakdown of how intent changes between Meta platforms, this article is useful: Facebook Ads vs Instagram Ads: How User Intent Differs.
What to Track in Search-Based PPC (Like Google Ads)
Google Ads works best when people already know what they want. Your job is to show up with the right message at the right moment.
These are the metrics that matter most.
1. Click-Through Rate (CTR)
CTR shows how often people click your ad after seeing it.
In search, CTR is mostly a relevance signal. If your ad closely matches the keyword, people click.
For example, if someone searches “accounting software for freelancers” and your headline repeats that phrase, your CTR will usually be strong.
A low CTR often means the ad copy does not align with the search intent.
2. Quality Score
Quality Score is Google’s way of judging how useful your ad is.
It’s based on three things:
-
How relevant the ad is to the keyword;
-
How helpful the landing page feels to users;
-
How often people click the ad.
Higher Quality Scores usually lead to lower CPCs and better ad positions.
3. Search Impression Share
This metric shows how often your ad appears compared to how often it could appear.
If impression share is low, it usually points to one of two problems. Either your bids are too low, or your budget runs out too early in the day. It’s a good diagnostic metric, not a performance one.
4. CPC and ROAS
-
CPC (Cost Per Click) tells you how expensive each visitor is.
-
ROAS (Return on Ad Spend) tells you how much revenue you earn from that spend.
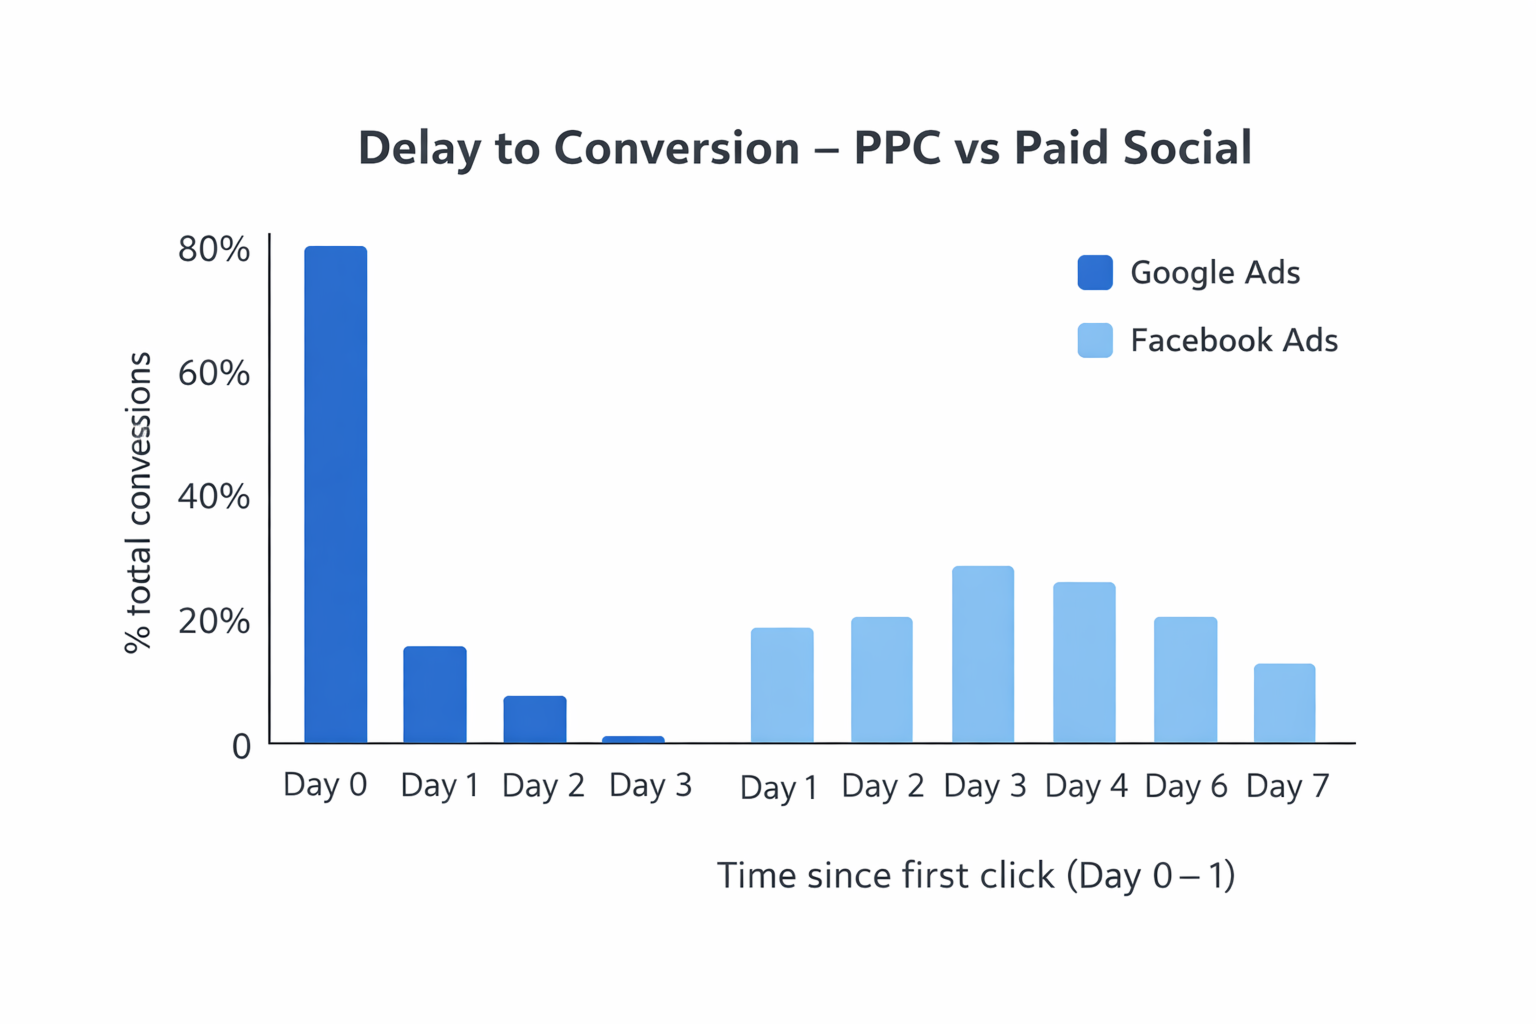
In search campaigns, ROAS is often stable and easier to interpret, because users convert quickly after clicking.
What to Track in Paid Social (Like Facebook and Instagram)
Paid social works differently. People are not searching, so ads need to earn attention first.
This is why creative quality and early engagement matter more than immediate conversions.
1. Thumbstop Ratio
Thumbstop ratio measures how many people watch at least the first three seconds of your video.
If users scroll past immediately, the ad never gets a real chance to work.
For example, a static product image often gets ignored. A short video showing the product in use, with motion in the first second, usually performs better.
This metric helps you judge creative strength before looking at sales.
2. Engagement Rate
Engagement includes likes, comments, shares, and saves.
On Meta platforms, engagement is not just vanity. It affects delivery. Ads with strong engagement are shown more often and usually at a lower cost.
If you want to go deeper into reading engagement signals correctly, this article expands on it well: How to Analyze Facebook Ad Performance Beyond CTR and CPC.
3. Watch Time
Watch time shows how long people stay with your video.
If most users drop off after two seconds, the opening is likely unclear or uninteresting. If they watch most of the video, your message and pacing are probably working.
Watch time often predicts future performance better than CTR.
4. CPM (Cost per 1,000 Impressions)
CPM reflects how expensive it is to reach people.
On paid social, CPM is strongly influenced by engagement and relevance. Ads that people interact with usually get cheaper reach over time.
A rising CPM can be a sign of creative fatigue or poor audience fit.
5. What Happens After the Click
Clicks on social media do not always mean intent.
Many users click out of curiosity. This is why post-click behavior matters:
-
Do users scroll or leave immediately?
-
How long do they stay on the page?
-
Do they visit more than one page?
These signals help you understand whether the ad promise matches the landing page experience.
Common Mistakes to Avoid
A common mistake is judging paid social ads by search standards.
Here’s what often goes wrong:
-
High CTR is treated as success, even when conversions are weak;
-
ROAS is judged too early, before delayed conversions show up;
-
Creative metrics are ignored in favor of bottom-line numbers.
This leads to scaling ads that look good on paper but perform poorly over time.
A better approach is to treat attention metrics as early indicators, then shift focus to conversions once you see consistent engagement.
Tips for Reading Social Metrics Like a Pro
Placement context matters more than many advertisers expect.
Different placements attract different behavior.
| Placement | How People Use It | What Works Best |
|---|---|---|
| Instagram Stories | Fast taps, low patience | Immediate motion, large text, clear hook |
| Facebook Feed | Slower scroll, more reading time | Strong headline, clear value message |
| Reels | Sound on, entertainment mindset | Native-style video, music, captions |
Example: A clothing brand ran the same video across placements. It failed in Stories but performed well in Reels. The Reels version felt organic and entertaining. The Stories version felt like a traditional ad and was skipped.
Final Thoughts: Choose the Right Metrics for the Job
There is no universal metric set that works everywhere. Search campaigns reward relevance and intent. Paid social rewards attention and engagement before intent appears.
If you are running Google Ads, focus on CTR, Quality Score, and ROAS. If you are running Facebook or Instagram ads, focus first on attention, engagement, and post-click behavior, then evaluate conversions over time.
Strong advertisers don’t chase numbers in isolation. They look at what each metric actually represents within its platform.