
Most lead generation reporting compresses everything into a single moment: the conversion. You look at CPL or even CPQL and assume performance is stable.
But lead quality doesn’t behave like that. It unfolds over time, and when you ignore that timeline, you miss where performance actually breaks.
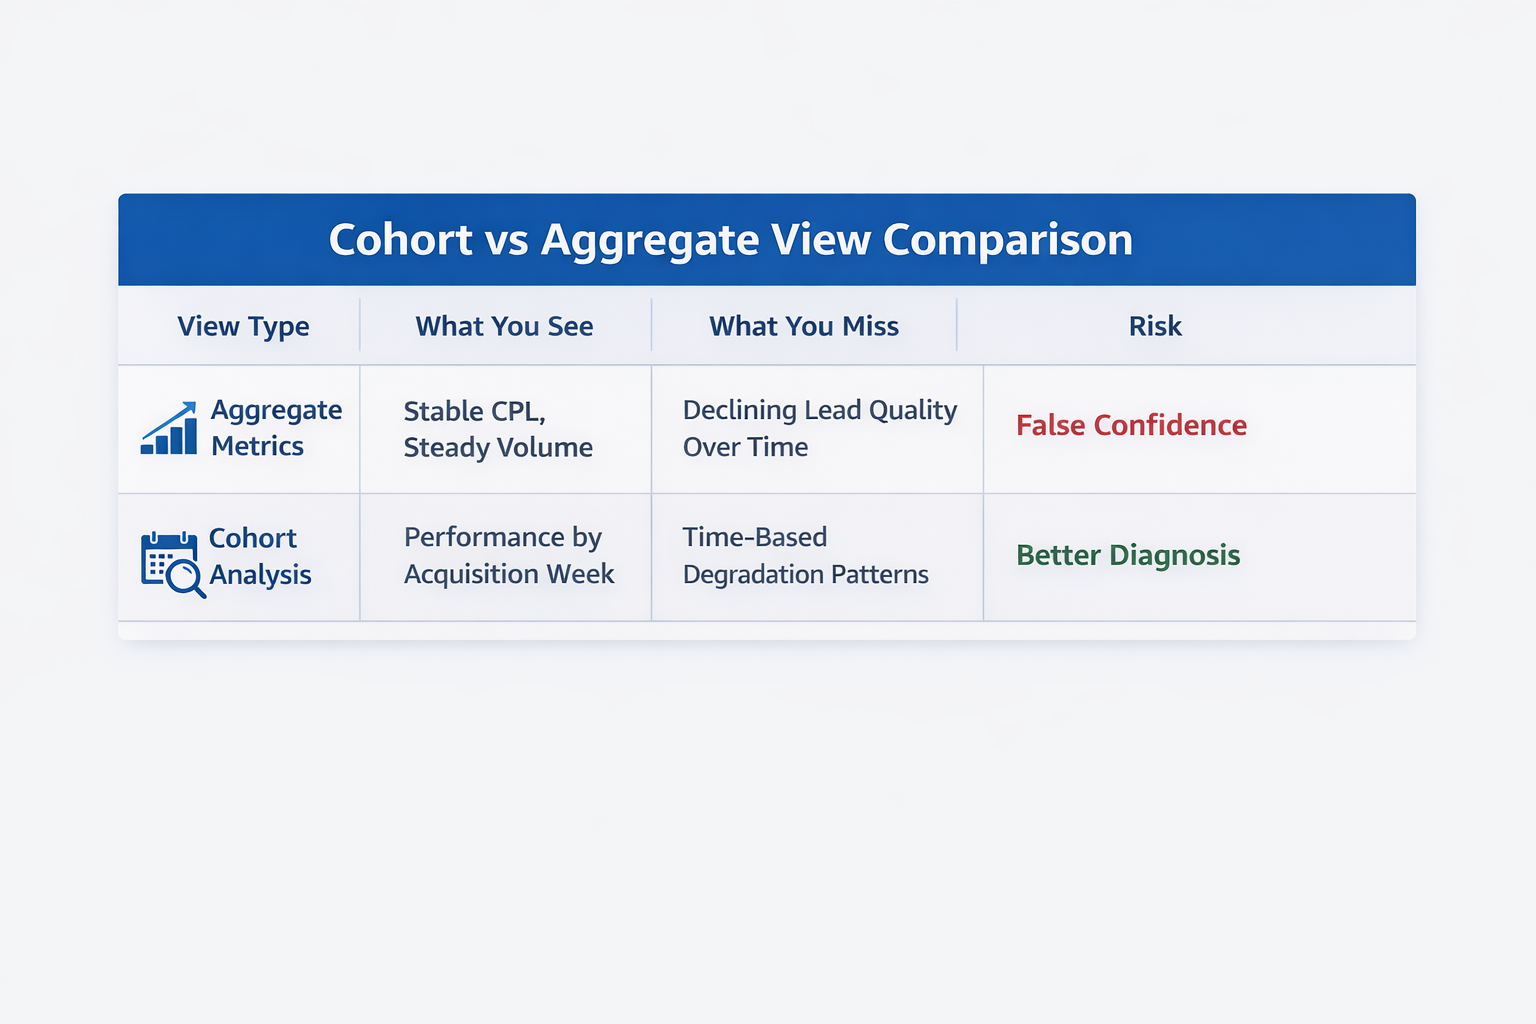
Why Standard Metrics Mislead
You can see stable CPL for weeks while pipeline quietly deteriorates.
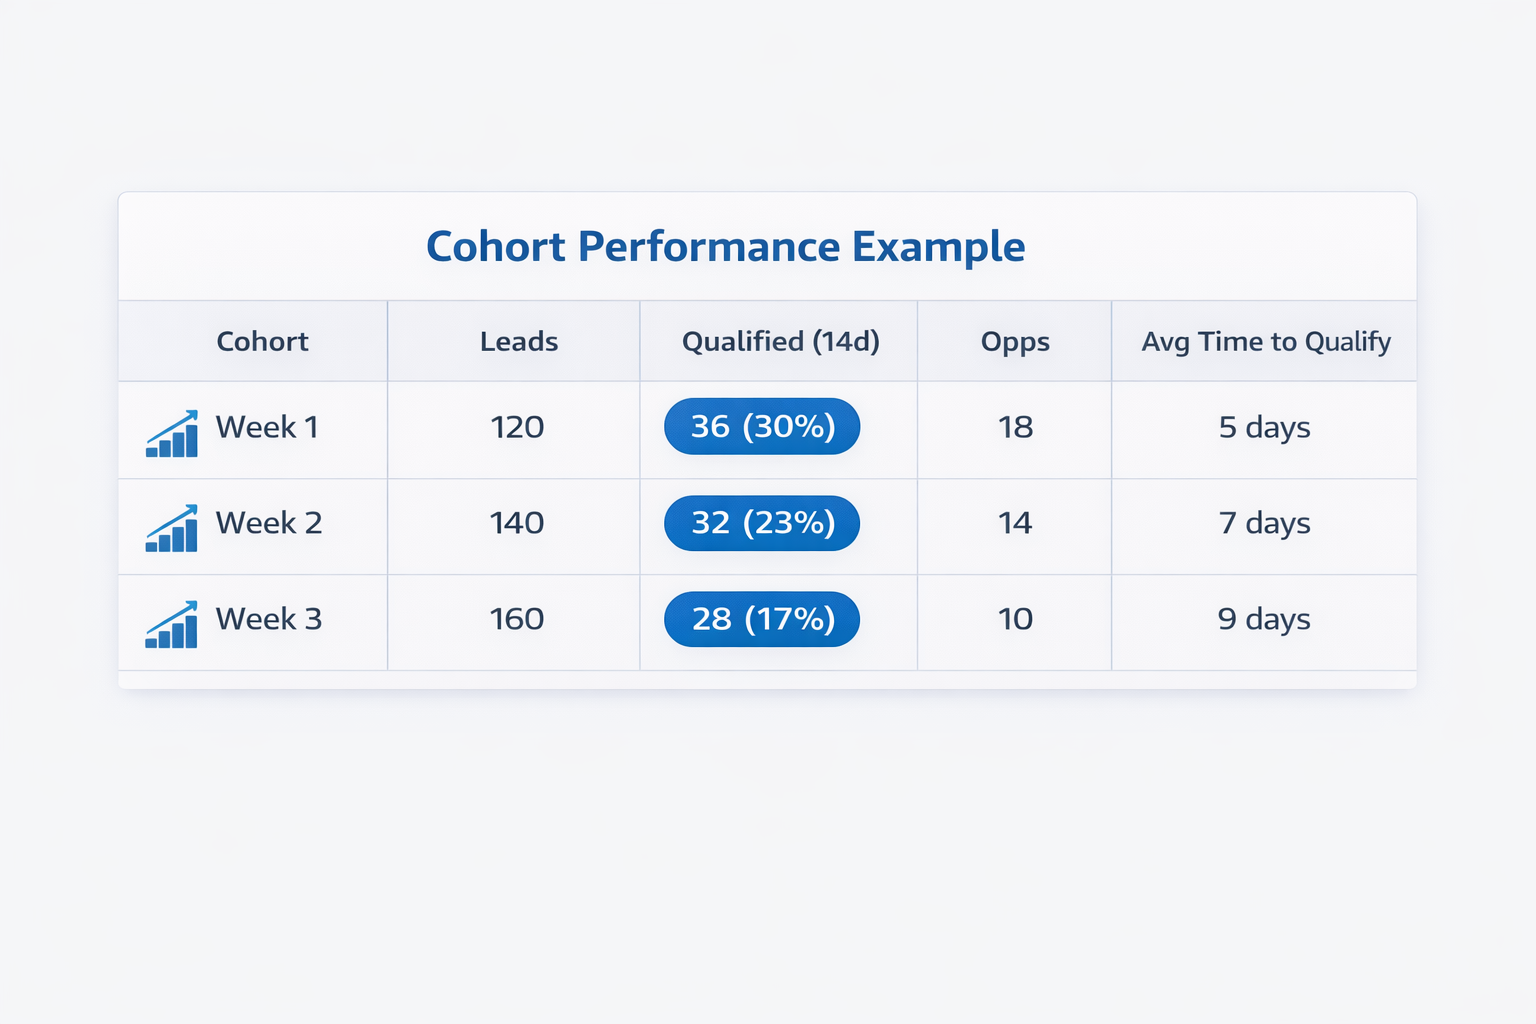
A typical pattern inside Ads Manager:
-
Week 1: $60 CPL, ~30% of leads qualify within 10–14 days.
-
Week 3: still $60 CPL, but qualification drops to ~18%.
-
Week 5: opportunities decline, even though top-of-funnel metrics look unchanged.
This is the same dynamic described in What Causes Facebook Lead Ads to Fail (Even When Metrics Look Good), where surface metrics stay stable while underlying quality declines.
What changed is not volume, but who is converting. As campaigns scale, the algorithm expands into weaker intent segments, and aggregate metrics hide that shift.
What Cohort Analysis Actually Shows
Cohort analysis groups leads and tracks what happens after they convert.
In practice, this means:
-
Group leads by acquisition week, so you can isolate performance by time.
-
Track how many qualify after 7, 14, and 30 days instead of relying on instant signals.
-
Compare progression to opportunity across cohorts to understand real pipeline impact.
This aligns with how performance should be evaluated beyond surface metrics, as explained in How to Analyze Facebook Ad Performance Beyond CTR and CPC.
Instead of one static number, you get a behavioral view:
-
Early cohorts tend to qualify faster and at higher rates.
-
Later cohorts slow down and drop off more.
That difference is the signal most teams miss.
The Mechanism Behind Cohort Decay
Ad platforms optimize based on recent conversion signals. If low-intent users convert, the system expands into similar profiles.
This is the same scaling effect outlined in The Science of Scaling Facebook Ads Without Killing Performance.
You can observe it directly:
-
Lead volume increases without proportional pipeline growth.
-
Time between lead and qualification gets longer.
-
Drop-off increases after the initial conversion.
Cohorts separate early high-intent traffic from later expanded traffic, making this drift visible.
A Simple Cohort Framework
You don’t need complex tooling to make this useful.
Start with three layers:
-
Time-based cohorts. Group leads weekly and track downstream performance to identify when quality shifts begin.
-
Time-to-event tracking. Measure how long it takes for leads to qualify or become opportunities. Delays often indicate weaker intent.
-
Source segmentation. Split cohorts by campaign or creative to understand what drives quality differences.
This ties into broader KPI discipline, especially when focusing on real outcomes instead of vanity metrics, as discussed in Marketing KPIs for B2B: What to Track (and What to Ignore).
Where Teams Go Wrong
Cohort analysis often fails not because of the method, but because of execution.
-
Comparing cohorts too early. Recent leads haven’t matured yet, so they appear weaker.
-
Over-aggregating campaigns. Mixing sources removes the ability to trace performance back to specific inputs.
-
Treating it as reporting only. If insights don’t influence targeting or creative, nothing improves.
The goal is diagnosis, not just visibility.
How Cohorts Change Optimization Decisions
Once cohorts are visible, optimization shifts from short-term efficiency to long-term value.
You start making different calls:
-
Accept higher CPL when cohorts convert faster into opportunities.
-
Pause campaigns that generate volume but weak downstream performance.
-
Prioritize creatives that consistently produce strong cohorts, even at lower scale.
This is where lead generation becomes a system, not a set of metrics.
Final Takeaway
Lead generation doesn’t break at the moment of conversion. It breaks across time.
Cohort analysis exposes that timeline. Instead of asking whether campaigns generate leads, you start seeing what kind of leads they generate — and how that changes as you scale.
And once that becomes visible, optimization becomes much more precise.