Most teams assume that when conversion rate declines, traffic quality must have deteriorated. In practice, you can see the opposite: stable CPMs, consistent CTR, even improving engagement metrics — yet conversions fall off.
This is not a traffic problem. It’s a system misalignment problem.
Once you look at how Meta actually processes post-click behavior and feedback signals, the drop becomes explainable — and more importantly, fixable.
Conversion Drops Often Start After the Click, Not Before It
A common scenario: CPM remains flat, CTR holds at ~1.5–2%, and frequency stays controlled. From a delivery standpoint, nothing looks broken. Yet form submissions or purchases decline by 20–40%.
What changed is not who you’re reaching, but what happens after the click.
There are three common post-click breakdowns:
-
Context mismatch between ad and landing page.
If the ad frames a problem in one way, but the landing page reframes it differently, users hesitate. You’ll often see session duration drop and scroll depth compress even though clicks remain stable. -
Increased friction in the conversion path.
Adding one extra required field, slowing page load by ~1–2 seconds, or introducing validation errors can reduce conversion without affecting upstream metrics. -
Expectation inflation from stronger creative.
High-performing creatives often promise clarity or speed. If the landing experience doesn’t deliver at that same level, the perceived gap causes drop-off.
This is exactly the type of issue explored in How to Improve Lead Conversion Rates From Facebook Ads.
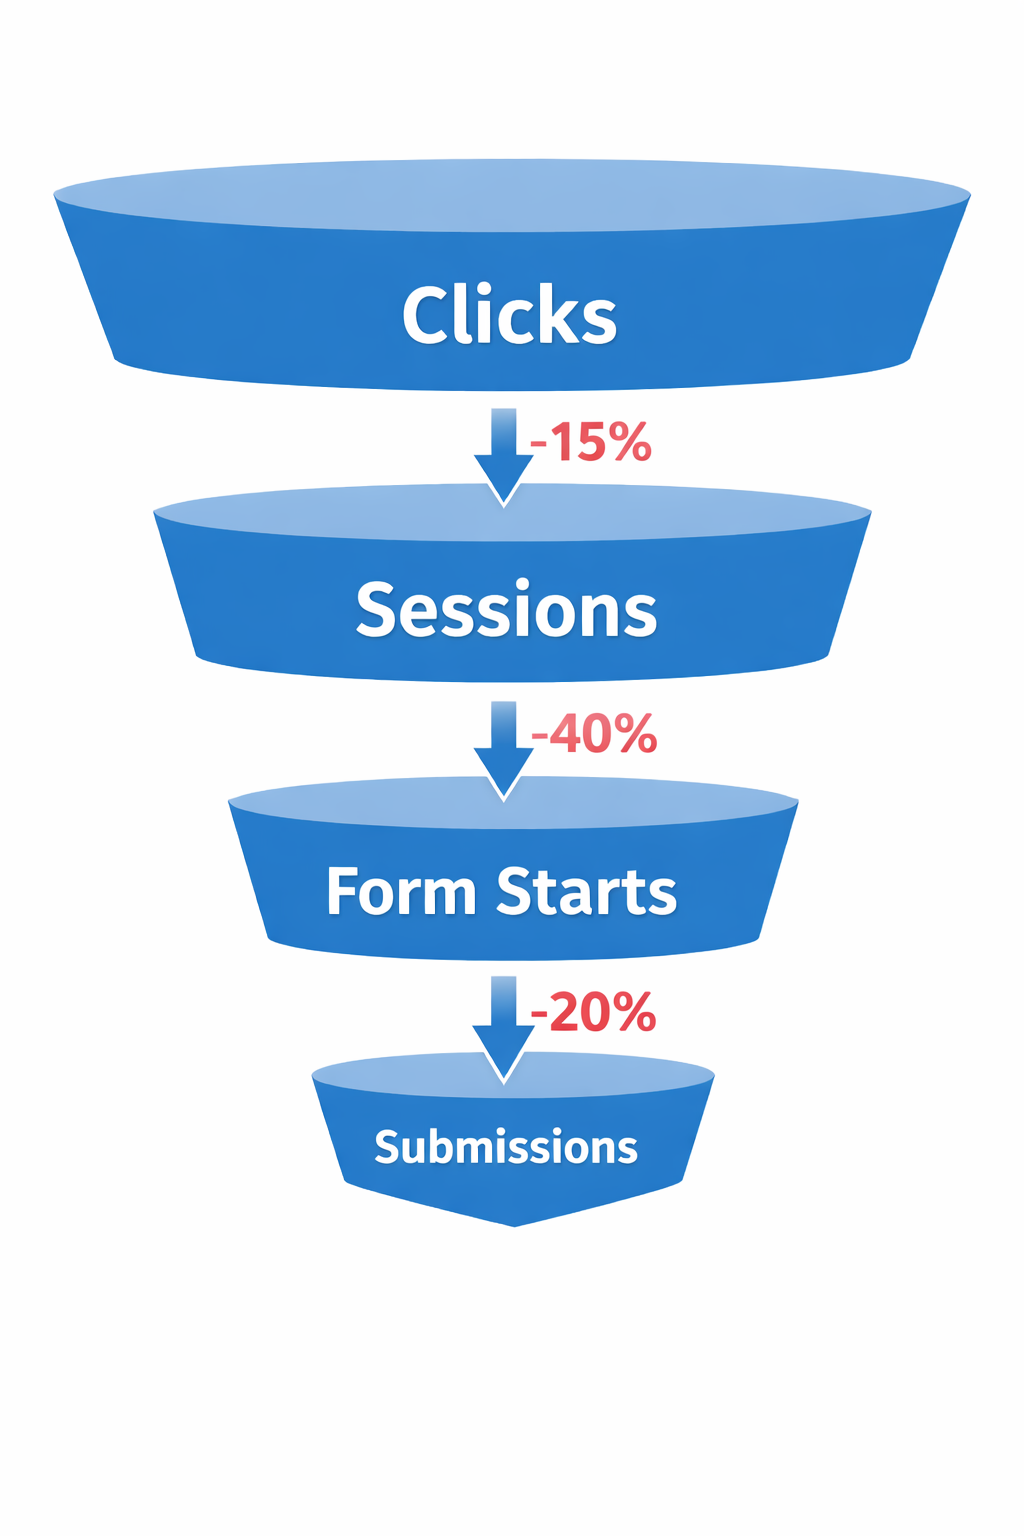
You can verify this inside analytics tools by comparing:
-
click-to-session ratio;
-
session-to-form-start ratio;
-
form-start-to-submit ratio.
If traffic quality were the issue, you would see deterioration earlier in the chain.
Algorithm Stability Can Mask Underlying Conversion Issues
Meta does not optimize for your internal conversion rate. It optimizes for event completion probability based on historical signals.
That distinction matters.
If your campaign has accumulated enough data, the system keeps targeting similar users — even if your conversion environment degrades.
Here’s what happens operationally:
-
The model continues entering auctions for the same behavioral clusters.
-
CTR and CPC remain stable because ad relevance hasn’t changed.
-
Conversion rate drops because the post-click system no longer performs.
This creates a misleading signal: delivery looks “healthy,” but outcomes deteriorate.
A typical indicator inside Ads Manager:
-
stable CPM;
-
stable or slightly improving CTR;
-
declining conversion rate over 3–5 days.
When those three appear together, the issue is rarely audience quality.
Frequency Doesn’t Always Show Saturation Directly
Teams often check frequency and stop there. If frequency is below 2.5–3.0, they assume saturation is not the issue.
That assumption is incomplete.
Saturation can occur within subsegments, not across the entire audience.
For example:
-
your top 20% most responsive users may already be seeing the ad 6–8 times;
-
the rest of the audience sees it once or twice.
The averaged frequency hides this concentration.
What this causes:
-
High-intent users disengage silently;
-
CTR remains stable because new users compensate;
-
conversion rate drops because the most likely converters are fatigued.
For a deeper breakdown, see Ad Fatigue on Facebook: How to Spot It Early and Fix It Fast.
A useful diagnostic pattern:
-
CTR flat or slightly up;
-
conversion rate down;
-
frequency only marginally increasing.
That combination suggests localized saturation, not broad fatigue.
Lead Qualification Filters Can Distort Conversion Trends
In B2B especially, conversion drops often correlate with subtle changes in qualification logic.
Example:
You tighten form requirements:
-
add company size field;
-
require work email instead of generic email;
-
introduce manual review before acceptance.
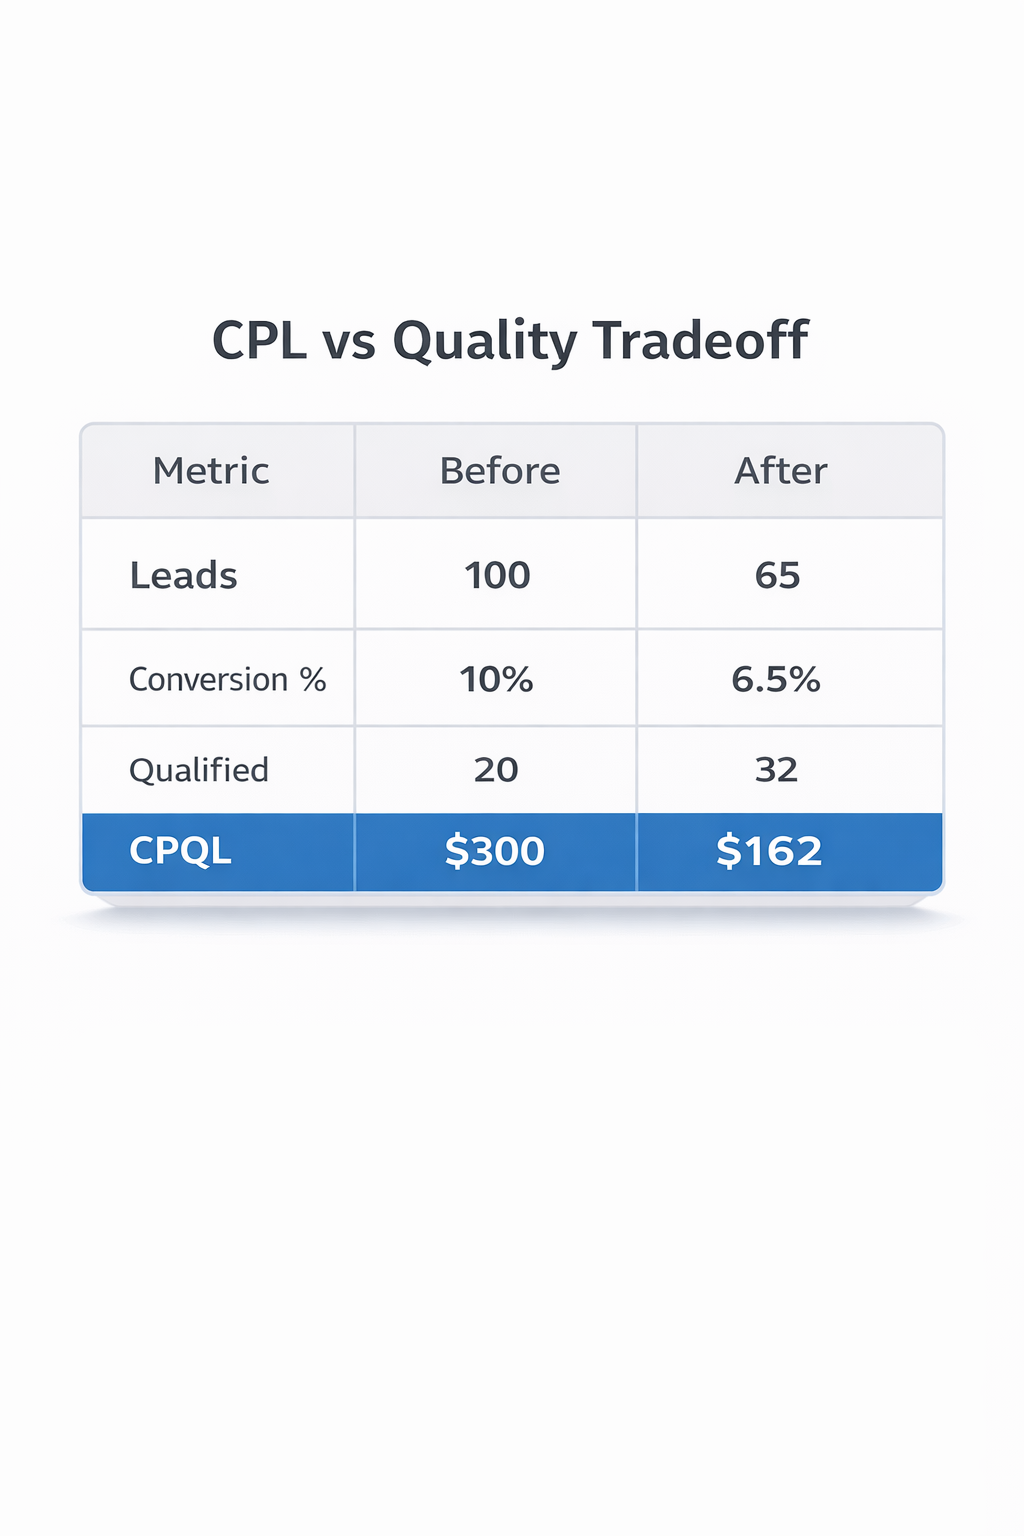
From a business perspective, this improves lead quality.
From a metrics perspective:
-
conversion rate drops;
-
CPL increases;
-
but downstream metrics improve.
This creates a false alarm if you’re only watching surface KPIs.
A more accurate read comes from comparing:
-
Conversion rate vs acceptance rate.
-
Conversion volume vs pipeline contribution.
This tradeoff is explained in more detail in Lead Quality vs Lead Volume: What Facebook Advertisers Need to Know.
Attribution Timing Can Create Artificial Drops
Conversion reporting is not instantaneous or evenly distributed.
If you shorten attribution windows or shift budget between campaigns, you can temporarily suppress reported conversions — even when real performance hasn’t changed.
Typical cases:
-
Moving from 7-day click to 1-day click attribution;
-
Increasing spend rapidly;
-
Launching new campaigns that reset learning.
What you observe:
-
traffic metrics react immediately;
-
conversion metrics lag by 24–72 hours or more.
For a deeper explanation, see Attribution Lag in Facebook Ads: Why Results Look Better (or Worse) Days Later.
Creative Evolution Can Break Conversion Alignment
When new creatives outperform old ones on engagement, teams scale them aggressively. That’s usually the right move — but it can introduce a hidden problem.
New creatives often:
-
attract a broader audience;
-
simplify the message to increase CTR;
-
remove friction in the ad itself.
This shifts the type of user entering the funnel.
The result:
-
CTR increases or stays stable;
-
CPC decreases;
-
conversion rate drops because intent is diluted.
Conversion Drops Can Come From Auction Dynamics, Not Users
Even when targeting stays constant, auction pressure can change who actually sees your ads.
If competition increases:
-
CPM rises for high-value users;
-
your ads win more impressions among lower-intent users.
From the outside:
-
audience unchanged;
-
traffic stable;
-
conversions down.
Under the hood:
-
impression quality shifted.
Practical Diagnostic Framework
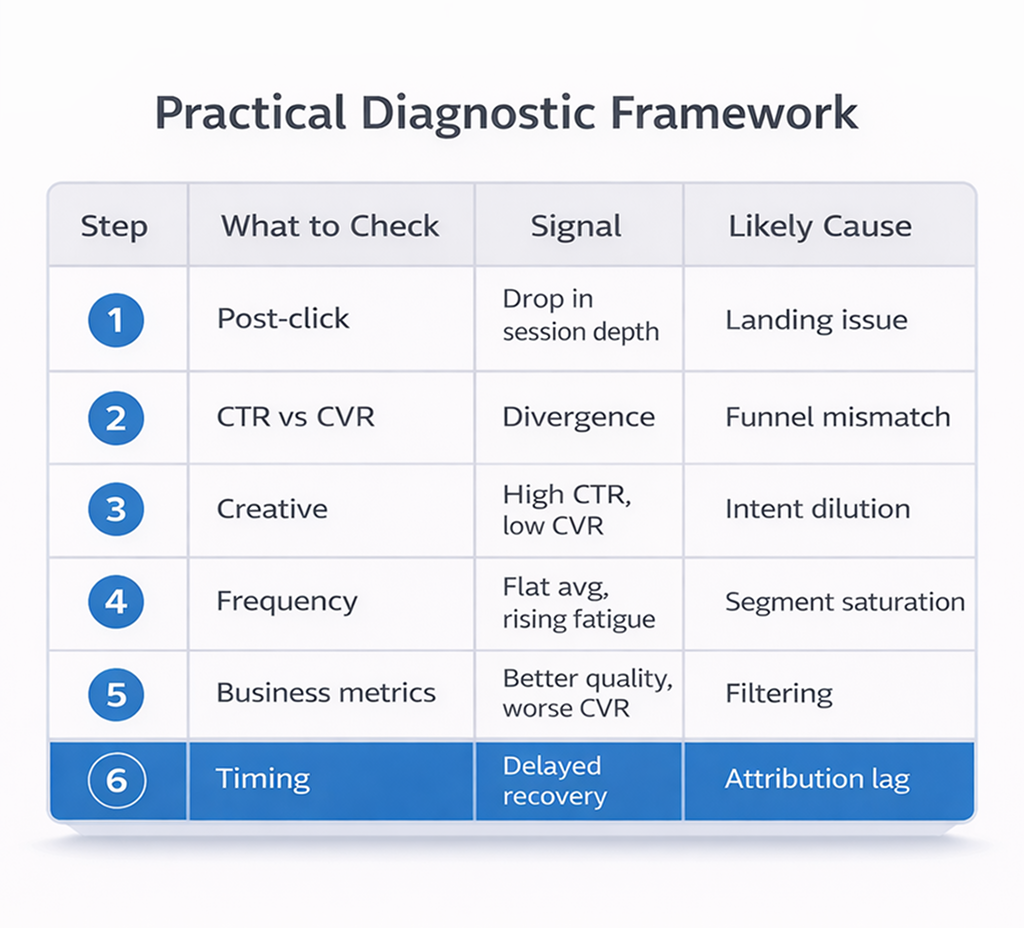
When conversion drops but traffic looks stable, isolate where the system breaks:
-
Step 1: Check post-click behavior.
-
Step 2: Compare CTR vs conversion trend.
-
Step 3: Segment by creative.
-
Step 4: Review frequency distribution.
-
Step 5: Align metrics with revenue outcomes.
-
Step 6: Account for attribution lag.
The Core Shift: Conversion Rate Is a System Output, Not a Traffic Metric
Conversion rate is influenced by:
-
targeting and auction dynamics;
-
creative messaging;
-
landing page alignment;
-
qualification logic;
-
attribution timing.
Traffic quality is only one component — and often not the one responsible.
When you treat conversion rate as a direct proxy for audience quality, you make the wrong adjustments.
A better approach is to treat it as the output of a multi-stage system.