
Advertising performance is often judged too quickly or too narrowly. A spike in clicks might look promising, but without context it can hide inefficient spend, weak lead quality, or poor post-click experience. Campaign health is best assessed through a balanced set of KPIs that measure efficiency, engagement, conversion, and long-term value.
Below are the key advertising KPIs that most accurately reveal whether a campaign is growing sustainably or quietly underperforming.
1. Cost Per Click (CPC)
CPC measures how much you pay for each click on your ad. While a low CPC is often desirable, it is not inherently a sign of success.
What it reveals:
-
Auction competitiveness and keyword or audience relevance
-
Ad creative alignment with user intent
How to interpret it:
According to industry benchmarks, average CPCs vary widely by channel and vertical, ranging from under $1 in display advertising to $2–$4+ in competitive search environments. A declining CPC paired with stable or improving conversion rates usually indicates improving campaign efficiency. A low CPC with weak conversions often signals poor traffic quality.
2. Click-Through Rate (CTR)
CTR shows the percentage of impressions that result in clicks.
What it reveals:
-
Ad message relevance
-
Creative strength and targeting accuracy
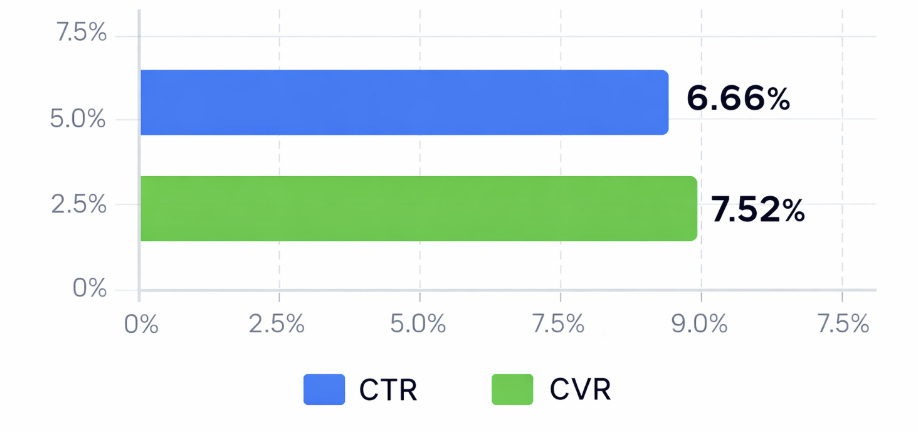
Average click-through rate (CTR) vs. conversion rate (CVR) in Google Ads search campaigns (2025)
How to interpret it:
Across major platforms, average CTRs typically fall between 0.5% and 1% for display ads and 3% to 6% for search ads. A rising CTR usually reflects better alignment between ad copy and audience intent. However, CTR should always be evaluated alongside conversion metrics to avoid optimizing for curiosity rather than outcomes.
3. Conversion Rate (CVR)
Conversion rate measures the percentage of users who complete a desired action after clicking an ad.
What it reveals:
-
Landing page effectiveness
-
Offer clarity and relevance
-
Funnel friction
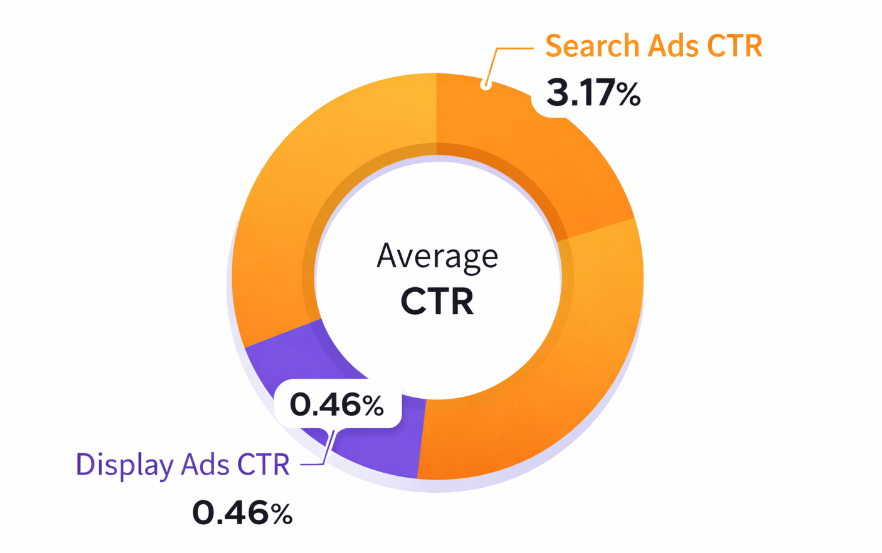
Comparison of average click-through rates between Search Ads (3.17%) and Display Ads (0.46%).
How to interpret it:
Well-optimized landing pages often achieve conversion rates of 5% to 10% or higher, depending on the offer and industry. If CTR is strong but CVR is low, the issue is rarely the ad itself; it is usually messaging mismatch, slow load times, or unclear value propositions on the landing page.
4. Cost Per Acquisition (CPA)
CPA measures the cost required to generate one conversion or lead.
What it reveals:
-
True efficiency of paid traffic
-
Alignment between ad spend and business goals
How to interpret it:
CPA should always be evaluated relative to customer value. A campaign with a higher CPA can still be healthy if lifetime value justifies the cost. When CPA rises while CTR and CVR remain stable, it often indicates increased competition rather than internal performance issues.
5. Return on Ad Spend (ROAS)
ROAS compares revenue generated to advertising spend.
What it reveals:
-
Revenue efficiency
-
Scaling readiness
How to interpret it:
Many advertisers target a minimum ROAS of 3:1 or 4:1, though this varies by margin structure. A declining ROAS may signal audience saturation, creative fatigue, or underperforming product-market fit. Consistent ROAS across increasing budgets is a strong indicator of campaign health.
6. Impression Share
Impression share shows how often your ads appear compared to how often they are eligible to appear.
What it reveals:
-
Budget constraints
-
Bid competitiveness
-
Market opportunity
How to interpret it:
If impression share is below 60% in high-intent campaigns, growth may be limited by budget or bidding strategy. High impression share with declining performance can indicate oversaturation or insufficient creative variation.
7. Frequency
Frequency measures how often the same user sees your ad.
What it reveals:
-
Creative fatigue risk
-
Audience saturation
How to interpret it:
For many paid social campaigns, performance often begins to decline once frequency exceeds 2.5–3.5. Rising frequency paired with falling CTR or CVR is a clear signal that creative refresh or audience expansion is needed.
8. Lead or Conversion Quality Metrics
Beyond volume-based KPIs, quality indicators provide deeper insight into campaign health.
Examples include:
-
Lead-to-opportunity conversion rate
-
Qualified lead rate
-
Revenue per lead
How to interpret it:
Research shows that up to 60% of generated leads may never convert into sales-ready opportunities. Campaigns that produce fewer but higher-quality leads are often healthier long-term than those optimized purely for low CPA.
Reading KPIs as a System
No single KPI can define campaign health in isolation. The most reliable insights come from observing patterns:
-
High CTR + low CVR = post-click problem
-
Low CPC + low lead quality = targeting mismatch
-
Stable CPA + declining ROAS = downstream revenue issue
Healthy campaigns show balance: efficient acquisition costs, consistent engagement, and strong post-click performance.
Conclusion
Advertising KPIs are diagnostic tools, not vanity metrics. When interpreted together, they reveal where campaigns are strong, where they are leaking value, and where optimization efforts will have the highest impact. Focusing on the right KPIs allows advertisers to move from reactive adjustments to strategic, data-driven growth.