As customer acquisition costs (CAC) continue to rise across digital channels, marketing leaders are under increasing pressure to demonstrate efficiency and revenue contribution. According to industry benchmarks, B2B organizations allocate between 7% and 12% of total revenue to marketing, with high-growth companies often exceeding 15%. However, the differentiator is not budget size, but allocation methodology.
Effective budget allocation models balance experimentation with predictable performance. They align channel investment with lifecycle stages, conversion efficiency, and revenue impact. This article examines quantitative frameworks and strategic models for allocating budget in scalable lead generation systems.
Core Principles of Scalable Budget Allocation
Before selecting a model, several foundational principles must be established:
-
Revenue-first orientation: Budget decisions should map directly to revenue targets and pipeline coverage ratios.
-
Data integrity: Accurate attribution, conversion tracking, and CRM integration are prerequisites.
-
Marginal ROI analysis: Investment should shift toward channels with the highest incremental return.
-
Lifecycle optimization: Allocation must consider top-of-funnel (TOFU), middle-of-funnel (MOFU), and bottom-of-funnel (BOFU) performance.
Organizations with strong marketing-sales alignment report up to 36% higher customer retention and 38% higher sales win rates compared to misaligned teams.
Model 1: Percentage-of-Revenue Allocation
Overview
This traditional model allocates a fixed percentage of projected or historical revenue to marketing. For example, a company targeting $10M in annual revenue may allocate 10%, resulting in a $1M marketing budget.
Advantages
-
Predictable budgeting framework
-
Easy executive alignment
-
Scales proportionally with revenue growth
Limitations
-
Does not account for market expansion or competitive intensity
-
May underfund aggressive growth initiatives
-
Ignores channel-level efficiency differences
This model is most appropriate for mature organizations with stable demand and established channel performance benchmarks.
Model 2: Objective-and-Task Model
Overview
This model begins with revenue goals and works backward through funnel metrics:
Revenue Target → Required Pipeline → Required Opportunities → Required MQLs → Required Leads
Example calculation:
-
Revenue target: $5M
-
Average deal size: $50,000
-
Close rate: 20%
-
Required opportunities: 500
-
MQL-to-opportunity rate: 25%
-
Required MQLs: 2,000
Budget is then allocated based on historical cost per MQL or cost per opportunity by channel.
Advantages
-
Fully revenue-aligned
-
Highly scalable
-
Data-driven
Limitations
-
Requires reliable historical conversion data
-
Demands advanced attribution modeling
High-performing B2B teams using structured funnel modeling report up to 20% lower customer acquisition costs over time due to improved forecasting accuracy.
Model 3: Marginal ROI Optimization Model
Overview
This quantitative model allocates incremental budget based on diminishing returns curves per channel. It evaluates the cost of acquiring each additional lead or opportunity as spend increases.
For example:
-
LinkedIn Ads may deliver $120 CPL at $20K spend
-
At $50K spend, CPL may increase to $180
-
Search advertising may remain stable at $140 CPL up to $60K
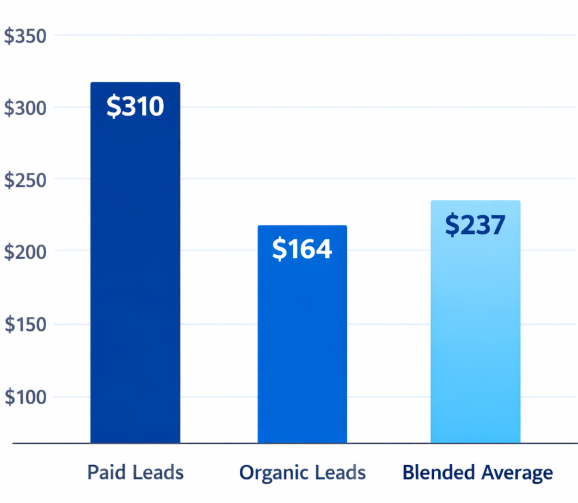
Average cost per lead by acquisition type (paid vs. organic vs. blended)
Budget shifts toward channels with stronger marginal efficiency.
Advantages
-
Maximizes efficiency at scale
-
Reduces overspending in saturated channels
-
Encourages performance experimentation
Limitations
-
Requires advanced analytics
-
Requires frequent optimization cycles
Organizations that reallocate budget quarterly based on performance data see an average 15–25% improvement in marketing ROI compared to static allocation models.
Model 4: Lifecycle-Based Allocation Model
Overview
This model distributes budget according to funnel stage needs. A common distribution in B2B environments:
-
40% Top-of-Funnel (awareness and prospecting)
-
35% Middle-of-Funnel (nurturing and qualification)
-
25% Bottom-of-Funnel (conversion and retargeting)
The allocation shifts depending on growth stage:
-
Early-stage companies emphasize TOFU
-
Growth-stage companies emphasize MOFU optimization
-
Mature companies emphasize BOFU efficiency and retention
Advantages
-
Balanced demand creation
-
Reduces pipeline volatility
-
Supports long-term scalability
Limitations
-
Requires clear lifecycle definitions
-
Attribution complexity increases
Model 5: Test-and-Scale (70-20-10 Rule)
Overview
This model reserves capital for innovation while protecting core revenue drivers:
-
70% proven channels
-
20% emerging but validated channels
-
10% experimental initiatives
This structure prevents overreliance on a single channel while enabling innovation.
Companies maintaining structured experimentation budgets report 30% faster identification of scalable acquisition channels compared to organizations with ad hoc testing.
Budget Allocation by Channel Category
In scalable B2B lead generation systems, budget typically distributes across:
-
Paid media (search, social, display)
-
Content and SEO
-
Data acquisition and enrichment
-
Marketing automation
-
Events and outbound campaigns
According to recent industry reports:
-
Paid channels often represent 45–60% of digital acquisition budgets
-
Content marketing drives 3x more leads than outbound marketing at 62% lower cost per lead
-
Email marketing generates an average ROI of $36 for every $1 spent
These benchmarks should guide allocation but not replace company-specific performance data.
Building a Scalable Allocation Framework
To implement scalable budget governance:
-
Establish baseline CPL, CPA, and pipeline contribution by channel.
-
Model revenue scenarios using historical conversion rates.
-
Define marginal efficiency thresholds.
-
Implement quarterly reallocation cycles.
-
Integrate predictive analytics into forecasting processes.
Advanced teams also deploy multi-touch attribution to improve visibility into assisted conversions, which can influence up to 70% of B2B purchase journeys.
Risk Management in Budget Allocation
Scalable systems mitigate risk by:
-
Avoiding single-channel dependency
-
Monitoring CAC payback period (ideal benchmark: under 12 months in SaaS models)
-
Tracking marketing-sourced revenue contribution
-
Maintaining data quality governance
Organizations with formal budget reallocation governance processes experience significantly less revenue volatility during market downturns.
Conclusion
Scalable lead generation requires disciplined capital allocation, not reactive spending increases. Percentage-based models offer stability, objective-driven models provide precision, marginal ROI models maximize efficiency, lifecycle-based models ensure balance, and test-and-scale frameworks preserve innovation.
The most effective organizations integrate multiple models into a dynamic allocation strategy supported by robust analytics and revenue forecasting. In competitive B2B markets, budget agility is a strategic advantage.