Many event teams still measure performance by surface-level KPIs: number of leads captured, total badge scans, cost per lead, or booth traffic. While these metrics are useful, they fail to answer the question that revenue teams care about most: How many of these contacts actually match our ideal customer profile and convert into pipeline?
Event match quality is the degree to which collected contacts align with your target accounts and buying personas. Without a clear benchmark, marketing and sales operate in the dark — celebrating quantity while revenue suffers.
This article defines practical match quality benchmarks, explains what strong performance looks like, and provides actionable guidance to improve outcomes.
Why Event Match Quality Matters
According to industry research:
-
61% of B2B marketers say generating high-quality leads is their biggest challenge.
-
Only 27% of event leads are typically sales-qualified.
-
Organizations with strong lead qualification processes generate 50% more sales-ready leads at 33% lower cost.
Events are among the most expensive marketing channels. Trade show participation, travel, booth production, and sponsorships often represent 20–30% of annual marketing budgets in event-heavy industries. When match quality is low, the cost of misalignment compounds quickly.
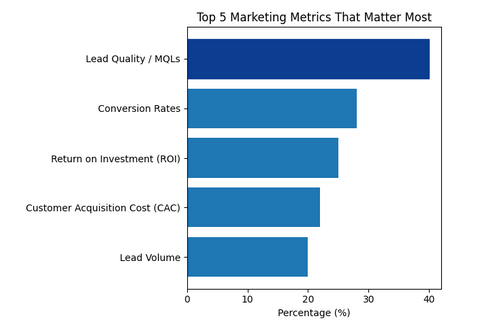
Lead quality is the single most prioritized metric for marketers, with 40% ranking it above all others
The key shift is this: Measure events by revenue contribution potential, not contact volume.
Defining Event Match Quality
Event match quality can be evaluated across four core dimensions:
1. Account Fit
-
Does the contact work at a target account?
-
Is the company within your defined industry, size, and geography?
2. Persona Relevance
-
Is the contact a decision-maker or influencer?
-
Does their function align with your buyer personas?
3. Buying Stage
-
Is there active intent or current initiative?
-
Is the timeline realistic?
4. Data Completeness and Accuracy
-
Is the record enriched and verified?
-
Can sales act immediately without manual research?
A high-quality event lead performs well across most or all of these categories.
Benchmarks: What “Good” Actually Looks Like
Below are practical benchmarks based on B2B performance averages and high-performing event programs.
Target Account Match Rate
-
Average: 15–25% of event leads match target account lists.
-
Strong performance: 35–50% match rate.
-
Best-in-class: 60%+ match rate at highly curated industry events.
If fewer than 20% of your leads align with target accounts, event targeting or pre-event outreach likely needs refinement.
Decision-Maker Ratio
-
Average: 20–30% of leads are director level or above.
-
Strong: 40%+ seniority alignment.
-
Best-in-class: 50%+ for account-based event strategies.
Average lead-to-opportunity conversion rates for qualified leads typically range from 12% to 18%, with higher performance signaling strong contact quality
High badge-scan counts often correlate with lower seniority percentages.
Enrichment & Deliverability Accuracy
-
Average data decay rate annually: 22–30%.
-
Strong enrichment coverage: 90%+ complete firmographic fields.
-
Email deliverability benchmark: 95%+ valid email rate.
If your bounce rate exceeds 5%, post-event enrichment and validation processes are insufficient.
Sales Acceptance Rate (SAL)
-
Industry average: 30–40% of marketing-qualified leads are accepted by sales.
-
Strong: 50%+ acceptance.
-
Best-in-class event programs: 60–70% acceptance.
SAL is one of the clearest indicators of match quality alignment between marketing and sales.
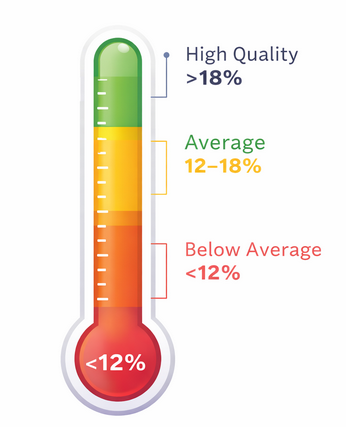
Pipeline Conversion Rate
-
Typical event lead-to-opportunity conversion: 5–10%.
-
Strong: 12–18%.
-
High-performing targeted events: 20%+.
When conversion exceeds 15%, it typically signals high account fit and persona targeting precision.
Warning Signs of Poor Match Quality
You likely have a match quality issue if:
-
Sales complains about "students," vendors, or irrelevant roles.
-
Follow-up requires heavy manual research.
-
Pipeline conversion from event leads remains under 5%.
-
Revenue contribution lags despite high booth traffic.
These symptoms reflect structural targeting or data alignment gaps.
Improving Event Match Quality
Improvement requires systematic changes before, during, and after the event.
1. Pre-Event Target Account Mapping
Upload and align your target account list before the event. Cross-reference registrant lists when possible and prioritize meetings with ICP-aligned companies.
Pre-scheduled meetings increase match rates by up to 2–3x compared to walk-up traffic.
2. Real-Time Qualification Frameworks
Equip booth teams with standardized qualification criteria:
-
Budget
-
Authority
-
Need
-
Timeline
-
Account relevance
Structured qualification increases sales acceptance rates by 20–30% compared to unstructured badge scanning.
3. Immediate Post-Event Enrichment and Scoring
Speed matters. Studies show that contacting leads within 24 hours increases qualification likelihood by 7x.
Automated enrichment ensures:
-
Company firmographics are validated.
-
Seniority and role are confirmed.
-
Contacts are matched against target accounts.
Scoring based on ICP alignment improves prioritization and sales efficiency.
Building a Match Quality Scorecard
To institutionalize benchmarking, create a post-event scorecard including:
-
Total leads captured
-
Target account match percentage
-
Seniority alignment rate
-
Valid email rate
-
Sales acceptance rate
-
Opportunity conversion rate
-
Revenue generated per matched account
Tracking these metrics event-over-event reveals which conferences deliver true revenue impact.
The Strategic Shift
High-performing revenue teams do not ask, "How many leads did we get?"
They ask:
-
How many target accounts did we influence?
-
How many decision-makers did we engage?
-
How much qualified pipeline did we generate?
When match quality becomes the primary KPI, event strategy becomes sharper, budgets become more defensible, and sales alignment improves.
Conclusion
Event match quality benchmarks provide clarity in a channel often dominated by vanity metrics. Strong programs consistently achieve:
-
35–50%+ target account match rate
-
40%+ decision-maker ratio
-
95%+ valid data rate
-
50%+ sales acceptance rate
-
12–18%+ pipeline conversion
If your metrics fall significantly below these thresholds, optimization is possible — and measurable.
Event success is not about traffic volume. It is about strategic alignment, qualification rigor, and data precision.
Recommended Reading
To further strengthen your event data and lead management strategy, explore these related articles: