Understanding which customers will deliver the highest long‑term value is essential for efficient marketing and sales. Cohort analysis provides a structured way to analyze behavioral patterns over time, helping teams identify high‑value segments and improve predictive lifetime value (LTV) targeting.
Why Predictive LTV Matters
Customer lifetime value (LTV) represents the total revenue a business can expect from a customer throughout their relationship with the company. Predicting LTV accurately allows organizations to:
-
Allocate marketing budgets more efficiently
-
Identify high‑value acquisition channels
-
Personalize retention strategies
-
Prioritize the most profitable customer segments
Companies that actively use predictive analytics for marketing decisions are significantly more competitive. According to research by McKinsey, organizations that leverage customer analytics extensively are 23 times more likely to outperform competitors in customer acquisition and nine times more likely to surpass them in customer loyalty.
However, traditional LTV models often rely on aggregated averages that fail to capture behavioral differences between customers acquired at different times or through different channels. This is where cohort analysis becomes essential.
What Is Cohort Analysis
Cohort analysis is a behavioral analytics method that groups users based on shared characteristics within a defined timeframe. The most common type is acquisition cohorts, where customers are grouped by the date or campaign through which they first interacted with a company.
For example, a business might create cohorts such as:
-
Customers acquired in January
-
Customers acquired via paid advertising
-
Customers who signed up during a product launch
Each cohort is then analyzed across time intervals—weeks, months, or quarters—to track metrics such as retention, revenue, engagement, or churn.
This approach reveals patterns that would otherwise be hidden in aggregated data. Instead of asking "What is our average customer lifetime value?" analysts can ask "Which acquisition cohorts produce the highest lifetime value over time?"
Why Cohort Analysis Improves Predictive LTV
1. Reveals Long‑Term Behavioral Patterns
Aggregated data blends multiple customer groups into a single average, which can obscure meaningful behavioral differences. Cohort analysis separates these groups, making it easier to identify patterns that influence long‑term value.
For instance, a cohort acquired through organic search may show slower initial conversion but significantly higher retention over 12 months. Another cohort from paid campaigns might generate faster early revenue but churn more quickly.
Understanding these patterns improves LTV forecasting accuracy.
2. Improves Retention Forecasting
Retention is one of the strongest predictors of lifetime value. According to Bain & Company, increasing customer retention by just 5% can increase profits by 25–95%.
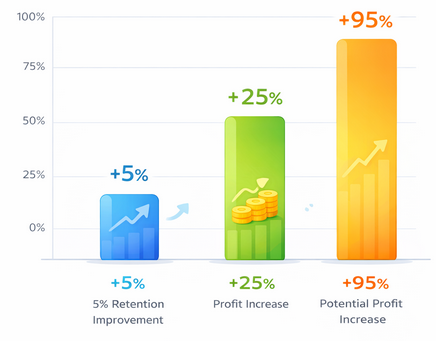
How small improvements in retention dramatically increase profitability
Cohort analysis enables teams to evaluate retention curves for each acquisition group. These curves can then be used in predictive models to estimate future revenue streams based on historical retention behavior.
3. Identifies High‑Value Acquisition Channels
Not all acquisition channels produce customers of equal value. Some channels attract users who make a single purchase, while others generate loyal repeat buyers.
By analyzing cohorts grouped by acquisition source, organizations can compare:
-
Average revenue per user
-
Purchase frequency
-
Churn rates
-
Long‑term customer value
This insight allows marketing teams to shift budgets toward channels that produce the highest LTV rather than those with the lowest acquisition cost.
4. Detects Early Signals of High‑Value Customers
Early behavioral signals—such as engagement frequency, product usage depth, or purchase timing—can indicate whether a customer will become high value.
Cohort analysis helps identify these signals by comparing early activity across cohorts that ultimately produced different lifetime values. Once identified, these signals can be integrated into predictive models.
Studies show that companies using behavioral data in predictive models can improve marketing ROI by 15–20% through better targeting and segmentation.
Building Cohort‑Based Predictive LTV Models
To integrate cohort analysis into predictive LTV targeting, organizations typically follow several steps.
Step 1: Define Cohort Criteria
Common cohort dimensions include:
-
Acquisition date
-
Marketing channel
-
Campaign or promotion
-
Product category
-
Customer demographic attributes
Choosing the right cohort criteria depends on the business model and available data.
Step 2: Track Cohort Metrics Over Time
Key metrics include:
-
Retention rate
-
Revenue per user
-
Average order value
-
Purchase frequency
-
Time between purchases
Tracking these metrics across consistent time intervals reveals how customer behavior evolves.
Step 3: Model Revenue Trajectories
Using historical cohort data, analysts can model expected revenue curves for different customer groups. These curves form the basis for predictive LTV estimates.
Machine learning models often incorporate cohort features alongside behavioral signals such as:
-
Session frequency
-
Product usage
-
Engagement events
-
Early purchase patterns
Step 4: Apply Predictive Targeting
Once LTV predictions are available, marketing teams can prioritize high‑value prospects and optimize campaigns accordingly. For example, organizations may:
-
Increase bids for audiences similar to high‑value cohorts
-
Personalize onboarding experiences
-
Trigger retention campaigns for at‑risk cohorts
Business Impact of Cohort‑Driven LTV Targeting
Organizations that integrate cohort analysis into their analytics workflows often see improvements across multiple metrics.
Common outcomes include:
-
Higher marketing efficiency due to better channel prioritization
-
Improved retention strategies
-
More accurate revenue forecasting
-
Better alignment between marketing and product teams
A study by Harvard Business Review found that companies using advanced customer analytics outperform peers in profit by up to 126% over time.
Cohort analysis provides the structural foundation for these insights by organizing behavioral data into meaningful, time‑based segments.
Best Practices for Effective Cohort Analysis
To maximize the value of cohort‑based LTV models, organizations should follow several best practices.
Maintain Data Consistency
Ensure tracking systems capture user events consistently across channels and devices. Inconsistent data can distort cohort comparisons.
Use Sufficient Time Horizons
Short observation windows can lead to inaccurate predictions. Many industries require 6–12 months of behavioral data to estimate lifetime value reliably.
Combine Cohorts with Behavioral Signals
Cohort segmentation becomes even more powerful when combined with granular behavioral metrics such as engagement intensity or product usage patterns.
Continuously Update Models
Customer behavior evolves over time. Predictive models should be retrained regularly using the latest cohort data.
Conclusion
Predictive lifetime value targeting enables organizations to allocate resources more effectively and focus on customers who generate long‑term revenue. Cohort analysis enhances these predictions by revealing behavioral patterns across customer groups, improving retention forecasting, and identifying the acquisition channels that produce the highest‑value users.
By structuring analytics around cohorts rather than aggregated averages, businesses gain deeper insight into how customer relationships evolve. This insight forms the foundation for more accurate LTV models and more effective growth strategies.