
When you’re running dozens of ads across Facebook and Instagram, confusion doesn’t creep in — it floods in.
Without a clear system, what starts as thoughtful testing turns into a maze of similar creatives, inconsistent metrics, and reactive decisions.
If you're managing multi-layered campaigns, you don’t just need structure — you need signal clarity. This guide will help you build and maintain it.
Why Clarity Degrades as Ad Complexity Increases
Every new audience, placement, or creative variation multiplies complexity. And complexity isn't inherently bad — but when it’s unmanaged, clarity suffers.
Symptoms of low-clarity setups:
-
Data becomes too fragmented to make real decisions;
-
Performance insights don’t translate into actionable steps;
-
Optimization cycles become reactive instead of strategic.
It’s not about fewer ads. It’s about better systems and more deliberate measurement.
Use Modular Campaign Architecture
Think of your campaigns as components, not containers. Instead of building campaigns around tactical ideas, build them around reusable logic blocks.
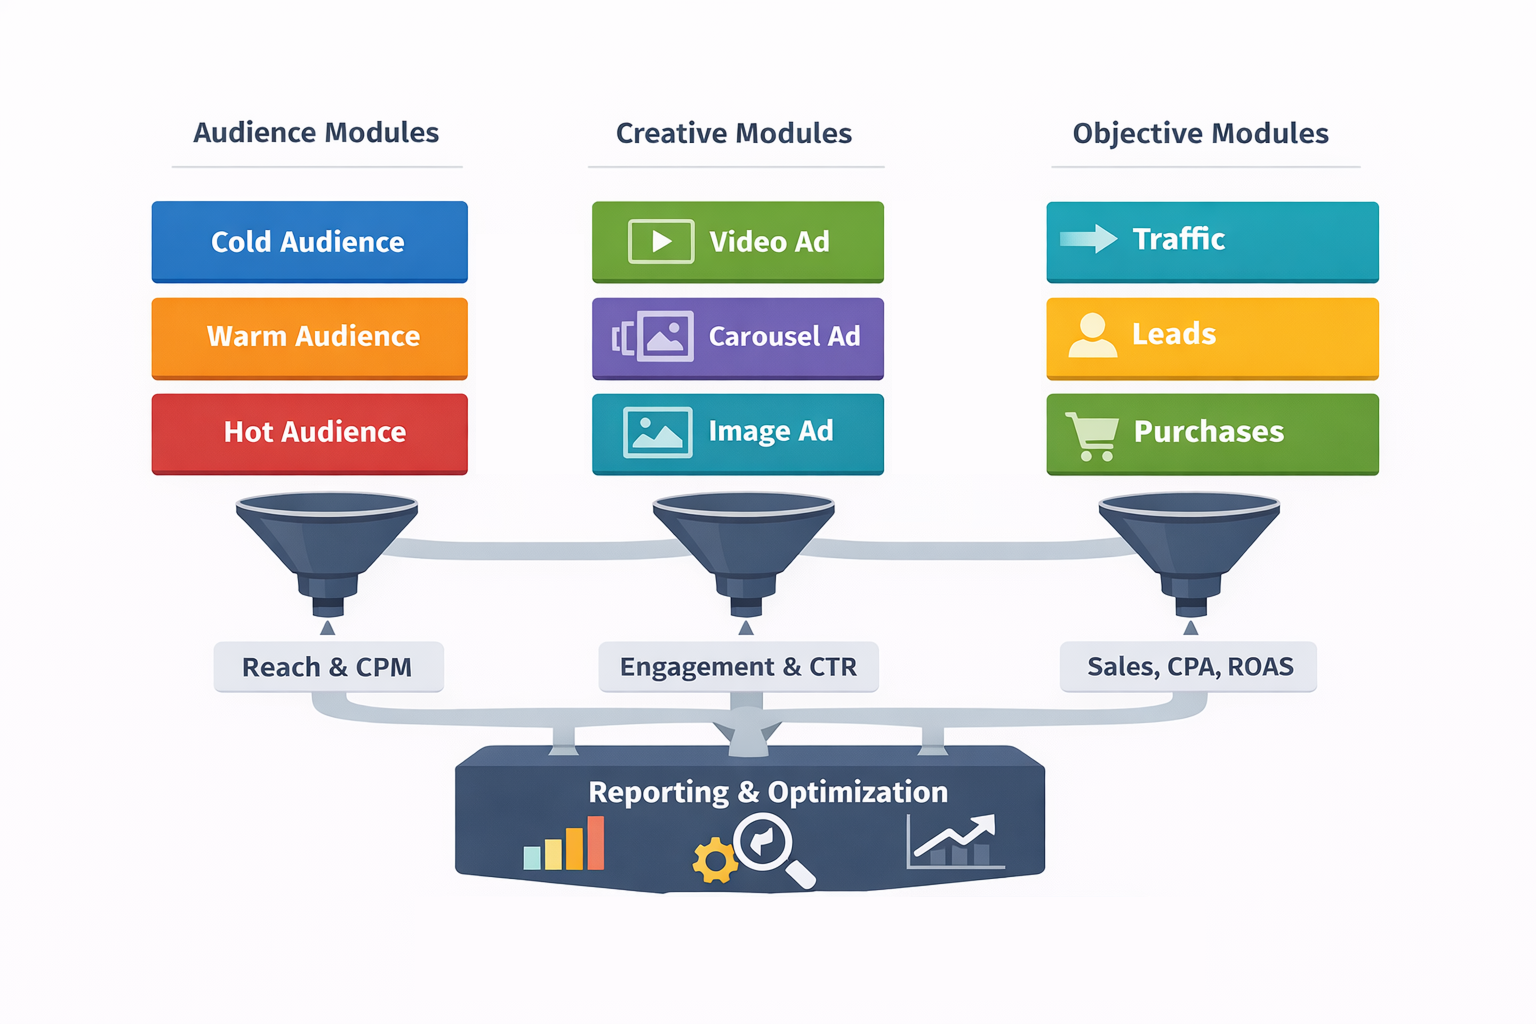
Examples of modular structure:
-
Audience modules: cold, warm, and hot segments, each isolated in their own campaign;
-
Creative modules: built to plug into any stage, clearly tagged by concept, format, and CTA;
-
Objective modules: separated by conversion depth — e.g., “ViewContent” vs. “Purchase”.
For more on clean campaign logic, read Meta Campaigns Explained: How to Structure High-Performance Campaigns.
Build Your UTM System Like a Database
A solid UTM strategy isn’t just for attribution. It’s for clarity.
When UTMs are structured right, they help you tie ad-level data back to specific hypotheses.
Use a schema that includes:
-
utm_campaign: matches your campaign objective or test theme — e.g.,TOFU_UCGLaunch; -
utm_content: details the creative — e.g.,Video_15s_BlueBG_Test3; -
utm_term: audience or targeting detail — e.g.,Lookalike3_Engagers_180d.
This structure becomes even more powerful when used with tools like the Facebook Attribution Tool, which helps reconcile performance across platforms.
Focus on Movement, Not Just Averages
One of the most common mistakes is evaluating campaigns by static averages. Advanced teams look for trends over time, not just snapshot metrics.
Here’s how to shift your analysis:
-
Track metric velocity — is ROAS climbing, plateauing, or crashing?
-
Map changes to specific variables — e.g., when CTR drops, was it a creative swap or algorithm shift?
-
Monitor performance decay — especially for high-performing creatives, which tend to fatigue faster than expected.
Not sure what to prioritize? This guide on key Facebook ad metrics that actually matter can help.
Use Control Groups — Even If Meta Doesn’t
Meta’s A/B testing tools are limited and rarely reflect full-campaign reality.
That’s why smart advertisers run manual control groups to measure lift.
Approach:
-
Set up a region, segment, or audience as a holdout — they see no ads, or only the evergreen baseline;
-
Measure organic lift vs. paid lift across conversions, signups, or other business KPIs;
-
Rotate the holdout over time to account for seasonality or offer timing.
This isn’t instant feedback — but it helps you understand what your ads actually drive versus what happens organically.
You can supplement this with split testing using Facebook’s Experiments section for faster comparisons.
Create “Insight Notes” Within Your Reporting Cycle
Data without interpretation is just noise.
To maintain clarity, you need to record why decisions were made — not just what happened.
Implement internal “insight notes”:
-
At the end of each campaign cycle, write a short entry: what changed, what hypothesis was tested, what insights were gained;
-
Use shared folders or tools like Notion, Airtable, or Google Docs for cross-team visibility;
-
Link notes directly to ad IDs or dashboards so context doesn’t get lost.
These notes also support long-term optimization and testing frameworks — like those used in high-performing creative testing campaigns.
Protect Your Data From Algorithm Interference
Facebook and Instagram’s algorithms optimize aggressively — sometimes too aggressively.
To preserve clean test conditions, you need to control the levers they’ll otherwise pull for you.
How to do that:
-
Use manual placements when testing creative format impact (e.g., Stories vs. Feed);
-
Disable campaign budget optimization (CBO) if ad set data needs to stay isolated;
-
Avoid early use of Advantage+ features when learning is the goal, not efficiency.
For more on when automation helps vs. hurts, see Meta Advantage+ vs Manual Setup.
Build Layered Dashboards With Drill-Down Logic
Surface-level dashboards don’t cut it once campaigns scale.
Design a dashboard system with 3 layers:
1. Top Layer: Executive Summary
-
High-level KPIs by funnel stage, updated daily;
-
Use color-coded alerts for anything outside normal variance.
2. Mid Layer: Campaign Performance
-
Breakdown by objective, audience, and creative;
-
Include change logs or annotations for version launches.
3. Deep Layer: Diagnostic View
-
Row-level data by ad ID;
-
Integrate UTM data, GA metrics, and attribution windows;
-
Pull in signals from outside platforms (email, product analytics, etc.).
If you’re not sure where to start, learn how to read ad reports like a growth marketer.
Final Thought: Complexity Isn’t the Enemy — Ambiguity Is
You don’t need fewer ads. You need clearer signals.
As you scale, your goal isn’t to reduce complexity — it’s to organize it.
Clarity is what lets you:
-
Test without second-guessing the results;
-
Scale what works, with confidence;
-
Cut what doesn’t, without hesitation.
For scaling strategies that won’t tank performance, check out this science-backed breakdown of how to scale Facebook ads.