
Heatmaps visualize how users interact with ads and landing pages by translating clicks, taps, scroll depth, and attention into color-coded maps. Instead of guessing why an ad underperforms, heatmaps show where users engage, hesitate, or drop off—making them a practical tool for performance optimization.
When used correctly, heatmaps help advertisers refine creative, improve landing page alignment, and remove conversion barriers that traditional metrics alone can’t explain.
What Heatmaps Reveal About Ad Performance
Heatmaps typically fall into three core types, each answering a different performance question:
-
Click heatmaps highlight where users click or tap. They reveal which elements attract attention—and which are ignored.
-
Scroll heatmaps show how far users scroll before losing interest, helping identify content placed too low on the page.
-
Move or attention heatmaps approximate cursor movement or eye focus, indicating what visually attracts users.
Together, these views provide context behind metrics like CTR, bounce rate, and conversion rate.
Key Statistics That Make Heatmaps Worth Using
Several industry findings highlight why heatmaps matter for ad optimization:
-
Users form a first impression of a page in under one second, making above-the-fold layout critical for ad-driven traffic.
-
Pages optimized using behavioral insights such as heatmaps often see conversion rate lifts ranging from 10% to 30% after layout and CTA adjustments.
-
Scroll depth studies consistently show that a significant share of users never reach content placed beyond the first screen, especially on mobile devices.
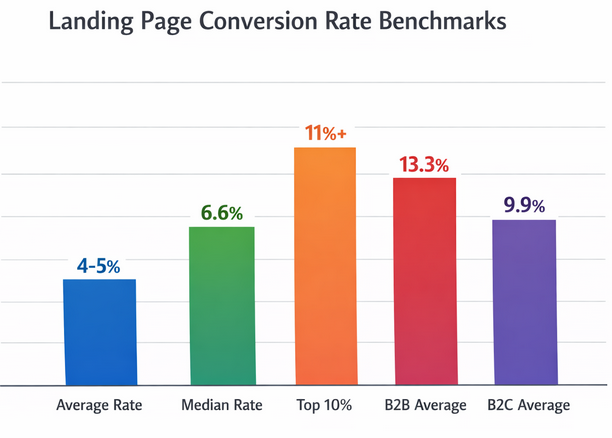
Comparison of landing page conversion rate benchmarks across different performance tiers and industries
These patterns explain why strong ads can still fail if landing pages don’t match user attention behavior.
Using Heatmaps to Improve Ad Creative
Heatmaps can be applied directly to ad creatives and pre-landing experiences:
-
Validate visual hierarchy: Check whether users focus on the headline, value proposition, and CTA in the intended order.
-
Detect distraction: If attention clusters around decorative elements instead of the message, simplify the design.
-
Optimize CTA placement: Click heatmaps often reveal whether CTAs are being overlooked or confused with non-clickable elements.
For display and native ads, these insights help refine layout and messaging before scaling spend.
Improving Landing Pages for Paid Traffic
Landing pages are where heatmaps deliver the highest ROI.
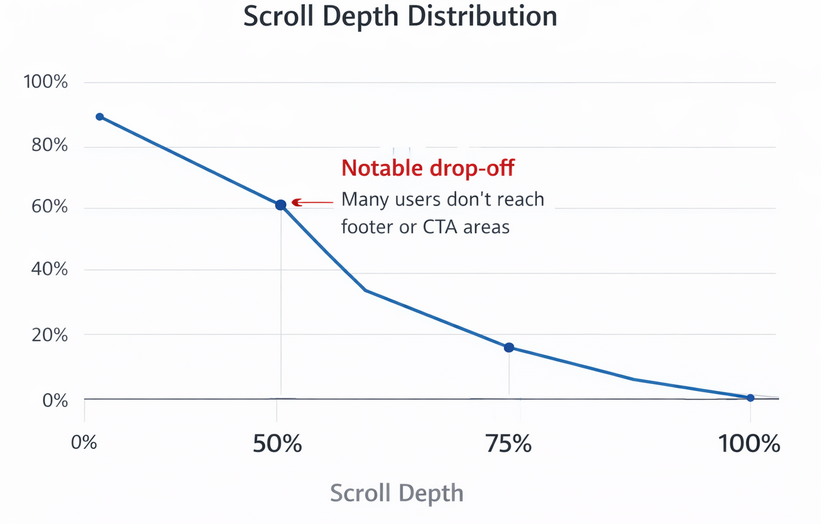
Scroll depth distribution showing how visitor engagement typically decreases further down the page
Use scroll heatmaps to determine:
-
Whether the primary value proposition appears early enough
-
If trust elements are seen before users drop off
-
How far users scroll before abandoning the page
Click heatmaps help identify:
-
Dead clicks on non-interactive elements
-
Confusion between primary and secondary CTAs
-
Form fields that cause hesitation or abandonment
By addressing these friction points, advertisers can increase post-click conversion rates without increasing ad costs.
Segmenting Heatmap Data for Better Insights
Heatmap data becomes more powerful when segmented:
-
Traffic source: Compare users coming from different ad platforms or campaigns.
-
Device type: Mobile heatmaps often reveal very different scroll and click behavior than desktop.
-
New vs. returning users: First-time visitors typically interact less deeply than repeat visitors.
Segmentation prevents misleading conclusions and ensures optimization decisions match real user intent.
Heatmaps and A/B Testing
Heatmaps work best alongside structured testing.
Use heatmaps to:
-
Generate hypotheses based on observed behavior
-
Validate whether a test variant changes interaction patterns
-
Detect false positives where metrics improve but usability worsens
Rather than replacing A/B testing, heatmaps explain why a test wins or loses.
Common Heatmap Mistakes to Avoid
Despite their value, heatmaps can be misused:
-
Relying on small sample sizes that don’t represent typical behavior
-
Ignoring mobile data while optimizing for desktop
-
Treating heatmaps as quantitative proof rather than directional insight
Heatmaps should guide decisions, not replace performance metrics.
Turning Heatmap Insights Into Action
To improve ad performance using heatmaps:
-
Start with high-traffic ad landing pages
-
Identify mismatches between user attention and key conversion elements
-
Make focused layout or messaging changes
-
Validate improvements through controlled testing
This workflow ensures insights translate into measurable performance gains.
Related Articles You May Find Useful
Final Thoughts
Heatmaps bridge the gap between ad metrics and real user behavior. By revealing how people actually interact with ads and landing pages, they enable smarter creative decisions, cleaner experiments, and more efficient scaling. Used consistently, heatmaps become a reliable source of insight for improving ad performance over time.