
Many marketing and product teams assume that increased activity equals increased intent. More page views, longer sessions, or repeated interactions are often labeled as positive indicators. In reality, some of the most common high‑engagement behaviors correlate with confusion, friction, or doubt rather than readiness to buy.
Studies in behavioral analytics show that up to 68–70% of online shopping sessions end in abandonment, even though many of them include multiple high‑intent actions such as feature comparisons or pricing page visits. This gap exists because not all actions signal progress toward a decision.
The Difference Between Progress and Friction
Progress behaviors reduce uncertainty. Friction behaviors amplify it. The challenge is that both can look identical in raw analytics.
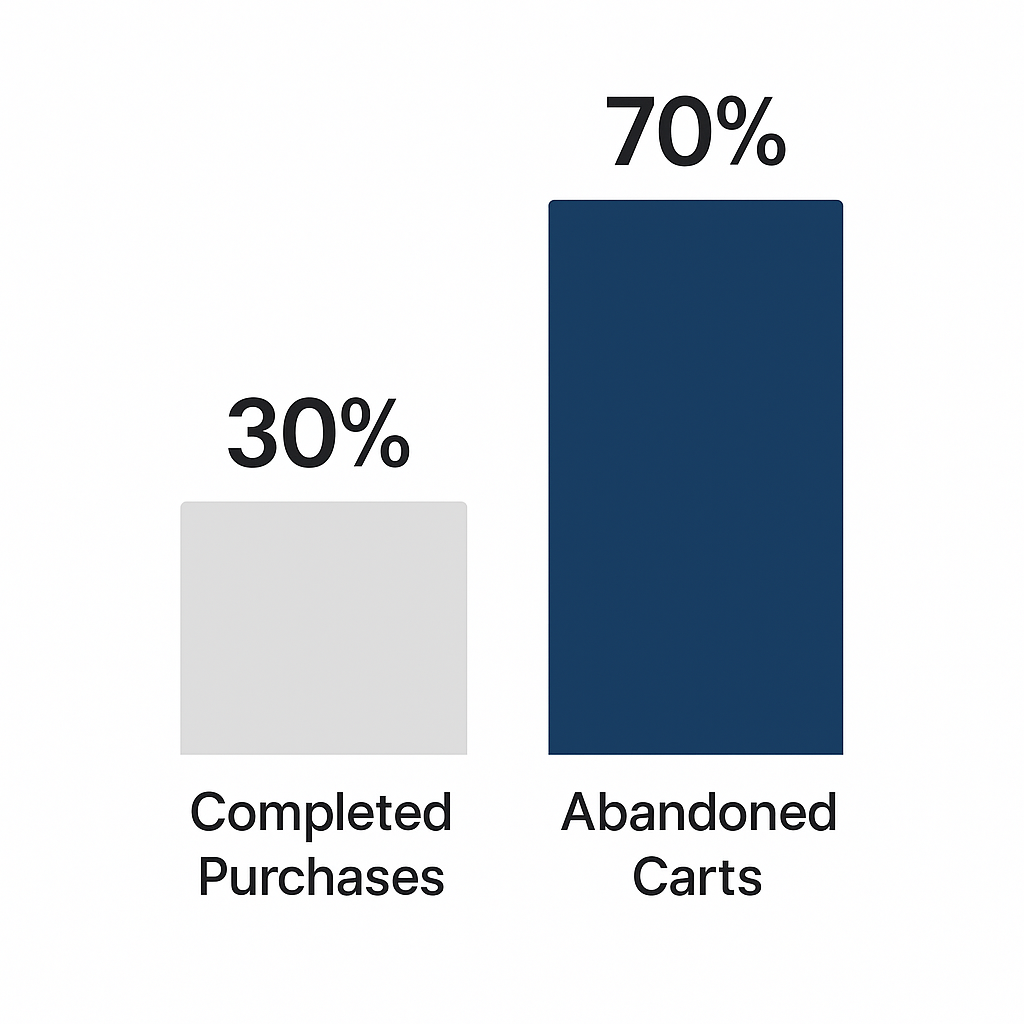
Only about 30% of users who add items to their cart complete a purchase, while around 70% abandon before checkout — signaling widespread hesitation rather than intent
For example, a user who visits a pricing page once and proceeds to checkout is exhibiting progress. A user who visits the same pricing page six times, scrolls extensively, and toggles between plans may be signaling unresolved concerns.
Behavioral analysis across e‑commerce and SaaS funnels consistently shows that excessive repetition is one of the strongest predictors of abandonment. Sessions with more than three repeated visits to the same decision page are associated with abandonment rates above 75%, compared to under 40% when the decision is made within one or two views.
Behaviors That Commonly Predict Abandonment
1. Repeated Back‑and‑Forth Navigation
Frequent switching between pages such as features, pricing, FAQs, and comparison tables often indicates that the user is searching for reassurance rather than moving forward. Heatmap and session‑recording data show that users who loop between two or more pages without progressing are significantly less likely to convert.
In aggregated funnel analyses, looped navigation patterns correlate with a 30–45% lower conversion probability compared to linear navigation paths.
2. Excessive Time on Decision Pages
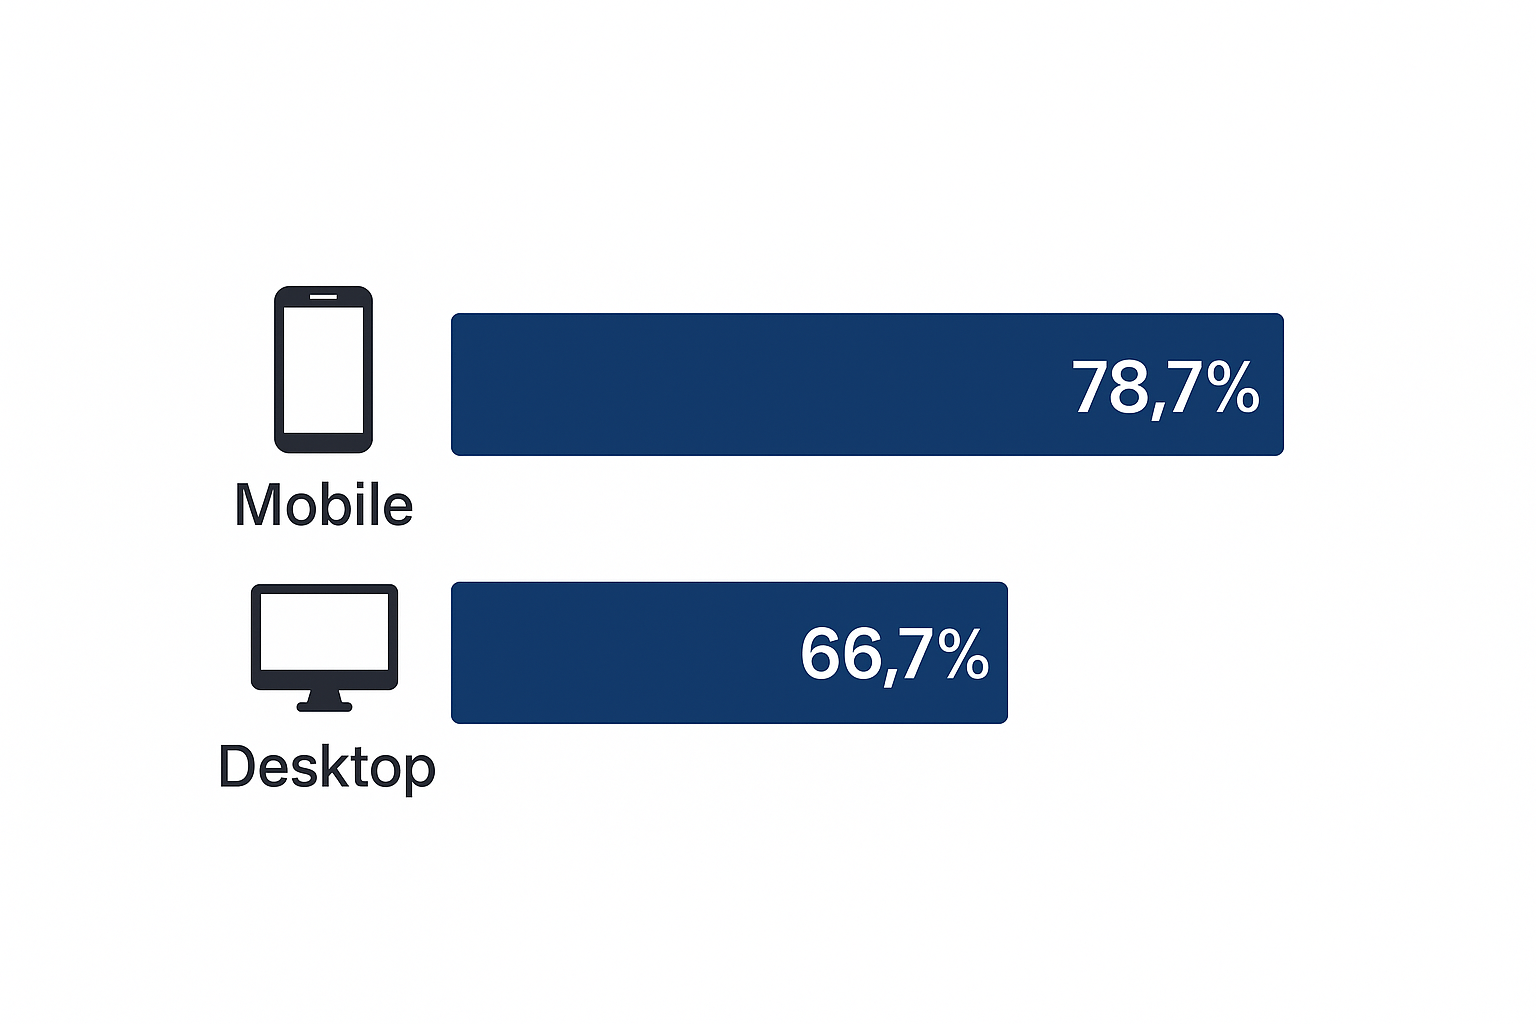
Abandonment rates vary by device: mobile users are more likely to abandon carts than desktop users, reflecting added friction in mobile experiences
Time on page is often treated as a positive signal, but context matters. Extremely long dwell times on pricing, checkout, or signup pages frequently point to hesitation.
According to usability benchmarks, decision pages with dwell times exceeding the 90th percentile have abandonment rates nearly double those of median‑time sessions. Long pauses often reflect confusion about value, trust, or terms rather than careful consideration.
3. Micro‑Interactions Without Commitment
Users may interact heavily with UI elements—opening tooltips, expanding accordions, hovering over fine print, or adjusting sliders—without taking irreversible steps. These micro‑interactions create an illusion of engagement while masking reluctance.
Data from product analytics platforms shows that sessions dominated by exploratory micro‑interactions but lacking commitment actions (such as form starts or checkout clicks) convert at rates below 10%.
4. Late‑Stage Field Errors and Corrections
Repeated edits in form fields, especially around payment, address, or company information, are strong abandonment indicators. Each correction increases cognitive load and perceived risk.
Research in form optimization indicates that sessions with more than two validation errors are up to 2.5× more likely to abandon than sessions with zero or one error.
Why These Signals Are Misclassified as Intent
The core problem is metric bias. Teams favor visible activity because it is easy to measure. Page views, clicks, and time spent feel actionable, but without behavioral context they can be misleading.
Abandonment‑predictive behaviors tend to increase activity, not reduce it. Users who are confused or uncertain often work harder to resolve their doubts, creating more events in analytics systems while moving further away from conversion.
How to Reframe Behavioral Analysis
To identify abandonment risk accurately, behaviors must be evaluated by their direction, not their volume.
Key reframing principles include:
-
Distinguishing between exploratory actions and commitment actions
-
Measuring repetition and loops, not just totals
-
Comparing dwell time against healthy benchmarks instead of assuming “more is better”
-
Tracking error recovery patterns rather than only form completions
When teams incorporate these lenses, predictive models become significantly more accurate. Behavioral scoring systems that weight friction signals correctly have been shown to improve abandonment prediction accuracy by 20–30% compared to volume‑based models.
Turning Abandonment Signals Into Optimization Opportunities
Abandonment‑predictive behaviors are not failures; they are diagnostics. Each pattern points to a specific type of uncertainty:
-
Repetition suggests unclear value differentiation
-
Long dwell time signals trust or pricing concerns
-
Micro‑interaction overload indicates information architecture issues
-
Form corrections highlight usability or clarity problems
Addressing these root causes often reduces abandonment without increasing traffic or spend.
Suggested Related Articles
-
Why Group Membership Predicts Purchase Intent Better Than Interests
-
Five Hidden Problems Inside Meta Campaigns (And How to Solve Them)
Final Thoughts
Not all engagement is progress. Some of the most active users are the ones closest to leaving. By learning to recognize behaviors that predict abandonment rather than purchase, teams can intervene earlier, design clearer journeys, and make decisions based on intent—not noise.