
Dashboards are essential for monitoring performance, but they are designed for visibility, not understanding. Metrics such as CTR, CPA, and ROAS show what is happening, not why it is happening. When decisions rely solely on these indicators, teams risk optimizing for short‑term improvements while missing deeper performance issues.
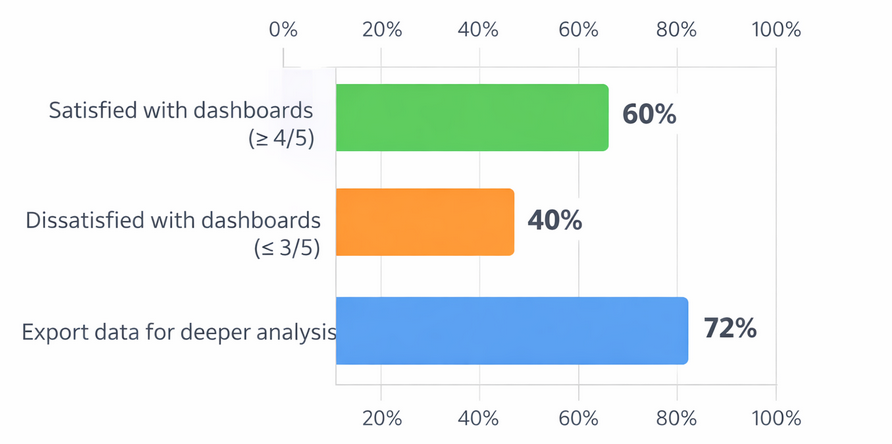
Marketers often find dashboards insufficient: 40% rate their dashboards below satisfactory, and 72% export data to analyze beyond what dashboards show
Industry data shows that over 65% of digital marketers primarily rely on platform dashboards for optimization decisions, yet more than 40% report difficulty explaining performance fluctuations to stakeholders. This gap often leads to reactive changes rather than strategic improvements.
The Hidden Context Behind the Numbers
Ad performance is influenced by factors that dashboards rarely surface:
-
Audience saturation and fatigue: CTR often declines by 30–50% once frequency exceeds 3–4 impressions per user.
-
Creative wear‑out: Even high‑performing ads typically lose effectiveness after 2–3 weeks without variation.
-
Traffic quality shifts: Scaling budgets can silently introduce lower‑intent users, reducing conversion rates even if CTR remains stable.

Over time, average click-through rates for online display ads have fallen from early double-digit percentages to around 0.2–0.3%, underscoring the need for deeper analysis beyond surface metrics
Without analyzing these elements, teams may pause campaigns that are actually structurally sound or scale campaigns that are already near exhaustion.
Looking Beyond Aggregate Metrics
Aggregate metrics smooth out critical signals. A blended CTR of 0.08% may hide the fact that one audience segment is performing at 0.18% while another is under 0.03%.
Breaking performance down by:
-
audience intent level
-
time since first exposure
-
device and placement context
-
creative variation
can reveal optimization opportunities that dashboards alone cannot highlight.
According to multi‑channel advertising studies, segmentation‑based analysis improves conversion efficiency by an average of 20–35% compared to campaign‑level optimization.
Behavioral and Qualitative Signals
Quantitative data should be complemented with behavioral indicators:
-
session duration and scroll depth after ad clicks
-
repeat visit rates from paid traffic
-
drop‑off points between landing page and checkout
For example, two campaigns with identical CPA can produce vastly different downstream value. One may drive users who bounce quickly, while the other attracts users who return organically later and convert at a higher lifetime value.
Surveys, on‑site feedback, and session recordings often uncover friction points that dashboards cannot measure directly.
Trend Analysis Over Snapshot Reporting
Dashboards encourage snapshot thinking: yesterday vs. today, this week vs. last week. Strategic analysis focuses on trends.
Tracking:
-
week‑over‑week creative decay
-
conversion lag between first click and purchase
-
performance changes after algorithm learning phases
helps teams anticipate declines before they become costly. Historical analysis shows that advertisers who act on early trend signals reduce wasted spend by up to 25%.
Turning Insight Into Action
Analysis beyond dashboards should always lead to clear decisions:
-
refresh creatives before fatigue thresholds are reached
-
reallocate spend based on audience depth, not volume
-
adjust landing pages based on post‑click behavior
The goal is not more data, but better judgment grounded in context.