
B2B advertising has traditionally prioritized rational value propositions: efficiency, ROI, scalability, and compliance. While these remain essential, relying exclusively on rational messaging limits performance.
According to LinkedIn’s B2B Institute, ads that balance emotional and rational messaging are 7x more likely to drive long-term brand impact. Meanwhile, Gartner research indicates that B2B buyers spend only 17% of their purchase journey meeting with potential suppliers. The majority of influence happens before direct sales interaction.
This means creative must:
-
Capture attention immediately
-
Align with buyer-stage intent
-
Reinforce credibility without overwhelming
-
Differentiate clearly in crowded categories
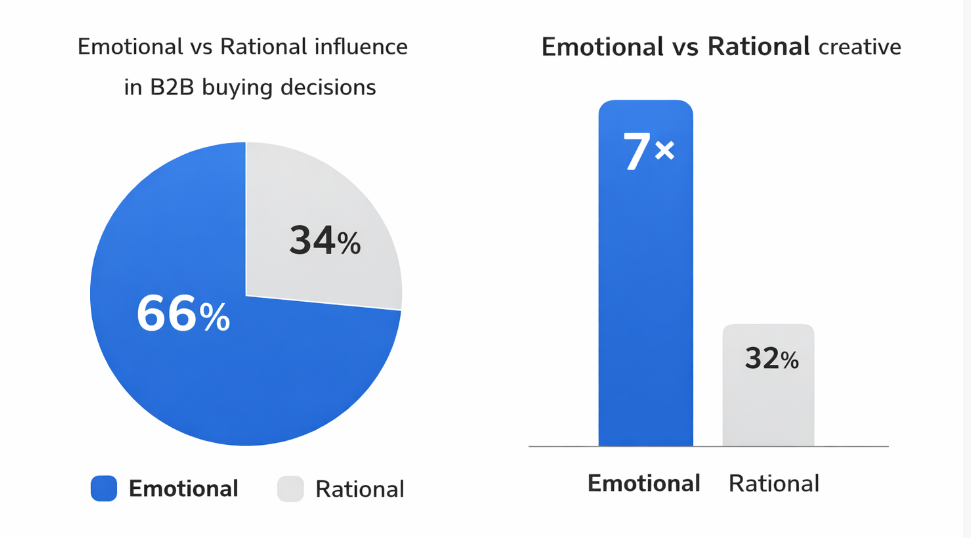
Emotional factors influence 66% of B2B buying decisions compared to 34% rational influence, and emotional creative is measured to be 7× more effective
The most effective B2B campaigns now use data to inform not only targeting—but also messaging architecture and visual storytelling.
1. Pain-Point Quantification Angle
Instead of stating a generic problem (“Struggling with low-quality leads?”), quantify it using industry benchmarks.
Example creative shift:
Generic:
"Improve your B2B lead generation."
Data-backed:
"42% of B2B marketers say poor lead quality is their top revenue blocker. Fix it."
Why it works:
-
Anchors the problem in validated research
-
Triggers pattern recognition
-
Establishes authority immediately
HubSpot reports that 61% of marketers rank generating traffic and leads as their biggest challenge. Integrating credible statistics directly into ad headlines increases perceived relevance and improves click-through rates in performance campaigns.
Execution tip:
Pair statistical headlines with visual dashboards, growth charts, or comparison graphics to reinforce analytical credibility.
2. Buyer-Stage Personalization Angle
McKinsey research shows that 71% of B2B buyers expect personalized experiences. However, personalization in ads is often limited to inserting industry names.
A stronger creative approach aligns messaging to:
-
Awareness stage: highlight problem cost
-
Consideration stage: compare frameworks
-
Decision stage: emphasize proof and outcomes
For example:
Awareness ad:
"Your ICP data may be outdated. Here’s what that costs you."
Consideration ad:
"Intent-based targeting vs static lists: performance comparison."
Decision ad:
"See how teams increased qualified pipeline by 38%."
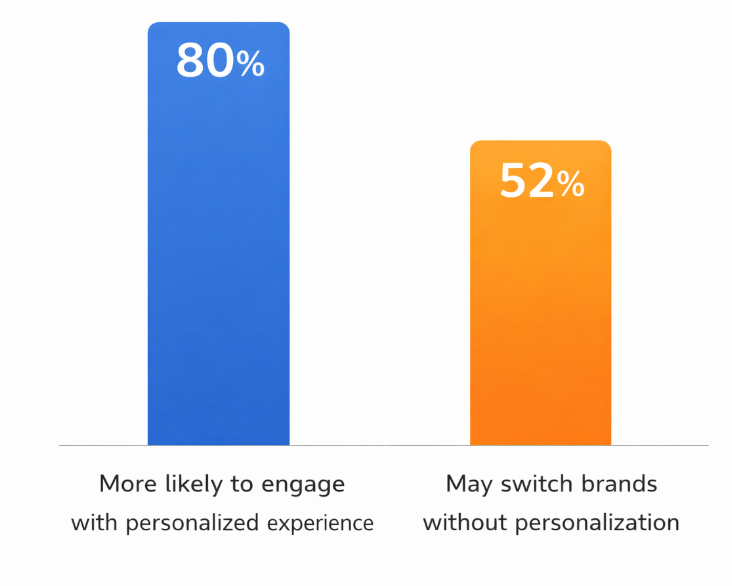
80% of B2B buyers are more likely to engage with personalized experiences, and 52% may switch brands if communication isn’t personalized
When ad creative reflects behavioral stage rather than demographic assumptions, engagement rates increase significantly. Segment-specific creatives often outperform generic ads by 20–30% in B2B campaigns.
3. Competitive Contrast Angle
In saturated B2B categories, differentiation drives performance more than feature lists.
Instead of describing your solution in isolation, use contrast-driven messaging:
-
"Stop buying outdated databases."
-
"Static leads vs real-time intent data."
-
"Manual research vs automated enrichment."
Contrast activates cognitive comparison mechanisms, which improves recall and response.
According to Nielsen, ads that clearly communicate differentiation can improve brand lift by up to 23%.
Execution tip:
Use split-screen visuals, checklists, or before/after layouts. Keep claims precise and defensible.
4. Revenue-Centric Angle
Many B2B ads focus on features (AI, automation, integrations). High-performing campaigns translate those features into revenue metrics.
For example:
Feature-driven:
"Advanced targeting filters."
Revenue-driven:
"Reduce wasted ad spend by up to 35% with precise targeting."
Demand Gen Report consistently finds that 76% of B2B buyers prioritize ROI clarity when evaluating vendors. Creative that foregrounds revenue impact shortens evaluation time and increases qualified conversions.
Best practice:
Include quantified outcome claims, supported by internal data or industry benchmarks.
5. Risk-Reduction Angle
B2B decisions involve multiple stakeholders and significant financial commitment. Risk mitigation is a powerful creative driver.
Examples:
-
"GDPR-compliant prospect data."
-
"Enterprise-grade security standards."
-
"Verified contact accuracy."
Edelman’s Trust Barometer reports that trust is a primary purchase driver in B2B. Creative that explicitly addresses compliance, security, and accuracy reduces friction during the evaluation stage.
Execution tip:
Highlight certifications, verification processes, or validation frameworks in the visual hierarchy.
6. Proof-Stacking Angle
Instead of a single testimonial, combine multiple proof signals in one creative unit:
-
Performance metric
-
Client quote
-
Industry recognition
-
Adoption statistics
For instance:
"Used by 3,000+ B2B teams."
"Average pipeline growth: 32%."
"Trusted across SaaS, fintech, and manufacturing."
Social proof layered with measurable results can increase conversion rates by reinforcing credibility from multiple dimensions.
7. Data Visualization Angle
B2B buyers are analytical. Transforming data into compelling visual narratives improves retention and clarity.
Instead of text-heavy creatives:
-
Show funnel drop-off visualization
-
Display enrichment accuracy comparison charts
-
Present cost-per-lead trend graphs
Visual cognition processes information 60,000 times faster than text. Ads that integrate structured visual data often see higher engagement rates, particularly on professional platforms.
Implementation Framework
To operationalize data-backed creative development:
-
Extract top-performing campaign data (CTR, CVR, CPL).
-
Identify statistical proof points from internal analytics.
-
Map messaging to buyer-stage segments.
-
Develop at least 3 contrast-based variations per segment.
-
A/B test statistical headlines vs benefit-only headlines.
Continuous iteration is critical. Creative performance in B2B environments typically stabilizes after 2–4 weeks, making ongoing testing essential.
Final Thoughts
B2B advertising is no longer a debate between creativity and analytics. The highest-performing campaigns integrate both.
When data informs creative angles—rather than merely validating them post-launch—ads become more relevant, more persuasive, and more defensible in ROI discussions.
Creative should not be speculative. It should be measurable.