Modern B2B revenue teams operate in an environment where the average buying journey includes 6–10 decision-makers and dozens of digital touchpoints before a purchase decision is made. According to industry research, companies using advanced analytics are 2.6 times more likely to outperform competitors in profitability, and organizations that align marketing and sales around shared data see up to 36% higher customer retention rates.
Despite this, many companies still measure performance in silos — marketing tracks clicks and leads, sales tracks pipeline and revenue, and operations attempts to reconcile conflicting numbers. The result is fragmented reporting, inconsistent attribution, and missed revenue opportunities.
Full-funnel analytics solves this by connecting data collection, enrichment, qualification, engagement, conversion, and retention into a unified measurement framework.
Stage 1: Strategic Data Collection
Every revenue engine starts with data. However, more data does not equal better decisions. High-performing organizations focus on structured, relevant, and compliant data acquisition.
Key Data Sources
-
Website behavior (page visits, form submissions, session duration)
-
CRM records (accounts, contacts, deal stages)
-
Marketing automation systems (campaign engagement, email performance)
-
Third-party enrichment and intent data
-
Product usage analytics (for SaaS organizations)
Poor data quality costs companies an average of 15–25% of revenue annually, according to Gartner estimates. Duplicate records, outdated contact information, and incomplete firmographic data directly distort conversion metrics and forecasting models.
Best practice: Define data ownership, establish validation rules, and implement automated enrichment workflows at the point of capture.
Stage 2: Data Normalization and Enrichment
Raw data must be standardized before it can power decision-making.
Normalization includes:
-
Standardizing company names and domains
-
Mapping job titles to functional roles
-
Aligning industry classifications
-
Unifying campaign naming conventions
Enrichment improves segmentation and targeting accuracy. For example, adding firmographic attributes (company size, revenue range, technology stack) enables more precise lead scoring and prioritization.
Organizations that leverage enriched customer data report up to 20% higher marketing ROI compared to those relying solely on first-party inputs.
Stage 3: Funnel Definition and Metric Alignment
A full-funnel analytics framework requires clearly defined lifecycle stages. Typical B2B funnel stages include:
-
Visitor
-
Lead
-
Marketing Qualified Lead (MQL)
-
Sales Qualified Lead (SQL)
-
Opportunity
-
Closed-Won
Each stage must have:
-
Entry criteria
-
Exit criteria
-
Measurable conversion benchmarks
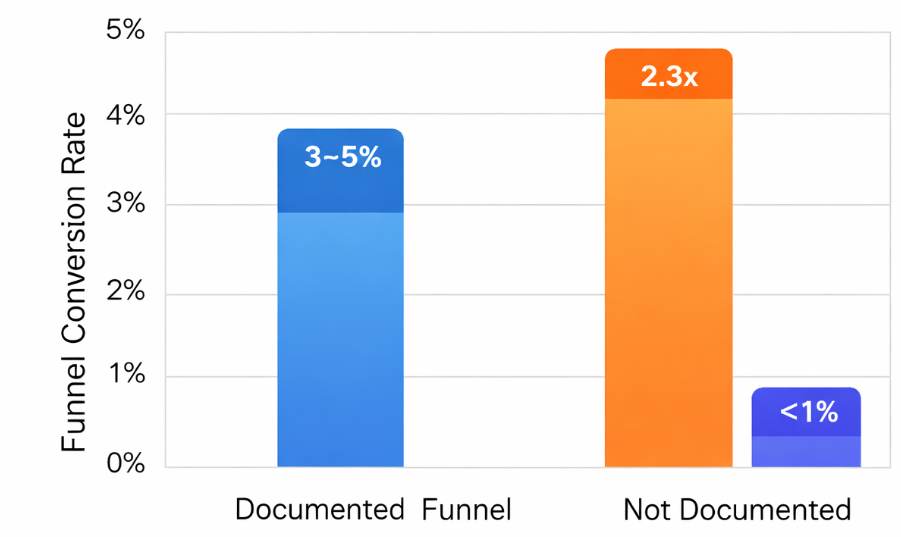
Average B2B sales funnel conversion rate (3–5%) and ROI comparison between companies with documented funnels versus those without
Without shared definitions, teams report conflicting conversion rates. Companies with aligned funnel definitions achieve up to 208% more revenue from marketing efforts compared to misaligned organizations.
Stage 4: Attribution and Revenue Mapping
One of the most complex components of full-funnel analytics is attribution modeling.
Common Attribution Models
-
First-touch attribution
-
Last-touch attribution
-
Linear attribution
-
Time-decay attribution
-
Multi-touch weighted models
No single model fits every business. However, multi-touch attribution provides more accurate revenue allocation in long B2B sales cycles, where deals often involve 20+ marketing interactions.
The objective is not to credit marketing activity for its own sake, but to understand which channels and touchpoints accelerate pipeline velocity and increase deal size.
Revenue mapping should connect:
Campaign → Lead → Opportunity → Revenue
This visibility allows leadership to calculate:
-
Cost per MQL
-
Cost per SQL
-
Customer Acquisition Cost (CAC)
-
Customer Lifetime Value (LTV)
-
LTV:CAC ratio
High-growth B2B companies typically maintain an LTV:CAC ratio between 3:1 and 5:1.
Stage 5: Predictive Insights and Optimization
Once the funnel is measurable, analytics evolves from descriptive to predictive.
Advanced revenue teams use:
-
Propensity scoring models
-
Account-level intent monitoring
-
Pipeline velocity analysis
-
Cohort retention analysis
-
Revenue forecasting algorithms
McKinsey research indicates that companies integrating AI-driven analytics into sales processes can increase lead conversion rates by up to 50% and reduce customer acquisition costs by 10–20%.
Optimization efforts typically focus on:
-
Shortening time between MQL and SQL
-
Increasing opportunity win rates
-
Improving average deal size
-
Reducing churn
Continuous testing and feedback loops ensure the funnel remains dynamic rather than static.
Breaking Down Silos: Marketing, Sales, and RevOps
Full-funnel analytics is as much an organizational transformation as it is a technical one.
Critical alignment elements include:
-
Shared dashboards and KPI definitions
-
Weekly pipeline reviews
-
Unified data governance policies
-
Closed-loop feedback between sales outcomes and marketing targeting
When revenue teams share a single source of truth, forecasting accuracy improves significantly. Organizations with mature revenue operations functions report up to 19% faster revenue growth and 15% higher profitability.
Common Pitfalls in Full-Funnel Analytics
-
Overreliance on vanity metrics (clicks, impressions)
-
Ignoring data hygiene
-
Failing to define lifecycle transitions
-
Using a single attribution model exclusively
-
Treating analytics as a reporting function instead of a decision framework
Avoiding these mistakes ensures analytics becomes a growth driver rather than a retrospective dashboard.
From Insight to Revenue: Implementation Roadmap
To operationalize full-funnel analytics:
-
Audit existing data sources and quality gaps
-
Standardize lifecycle definitions
-
Integrate marketing, CRM, and sales systems
-
Implement multi-touch attribution
-
Establish revenue-focused KPIs
-
Deploy predictive scoring models
-
Create executive-level revenue dashboards
Execution should follow a phased approach, prioritizing data integrity before advanced modeling.
Conclusion
Full-funnel analytics transforms fragmented performance tracking into a coherent revenue intelligence system. By connecting structured data collection, standardized lifecycle stages, multi-touch attribution, and predictive modeling, organizations gain visibility into what truly drives growth.
Companies that treat analytics as a strategic capability — not just a reporting tool — create a competitive advantage built on measurable, repeatable revenue generation.
Recommended Articles
For further reading, explore these related articles: