
Most advertising platforms provide dozens of metrics: impressions, clicks, CTR, CPC, CPA, ROAS, frequency, and more. The problem isn’t the lack of data—it’s the lack of interpretation.
According to industry research, marketers review campaign metrics at least once per day, yet over 60% admit they are unsure which metrics directly influence business outcomes. This gap leads to reactive optimizations instead of strategic improvements.
Reading ad reports correctly means understanding what a metric signals, why it changed, and what action it should trigger.
The Three Levels of Ad Metrics
To turn reports into decisions, group metrics into three functional layers.
1. Exposure Metrics: Are the Right People Seeing Your Ads?
These metrics indicate whether your ads are reaching an audience efficiently.
Key metrics to monitor:
-
Impressions
-
Reach
-
Frequency
-
CPM (Cost per 1,000 impressions)
Useful benchmark: campaigns with a frequency above 3.5 often experience declining click-through rates as ad fatigue increases. A rising CPM combined with stable creative usually signals audience saturation.
Action signals:
-
High CPM + rising frequency → expand or refresh the audience
-
Stable CPM + low reach growth → test broader targeting layers
2. Engagement Metrics: Do People Care Enough to Act?
Engagement metrics show how compelling your message is to the audience reached.
Key metrics to monitor:
-
CTR (Click-through rate)
-
CPC (Cost per click)
-
Landing page views
-
Engagement rate
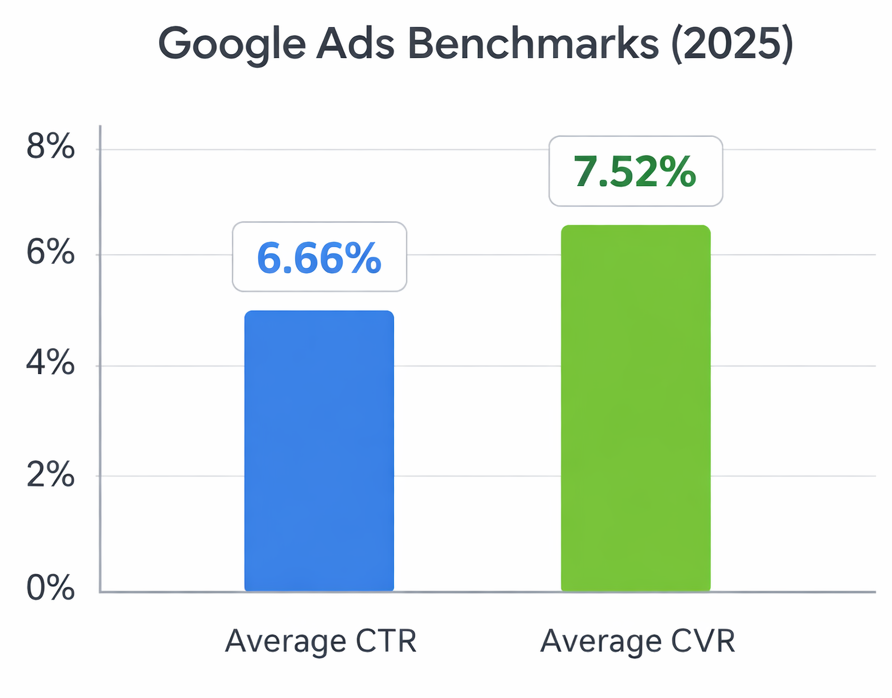
Average click-through rates (CTR) and conversion rates (CVR) for Google Ads in 2025, showing how engagement aligns with meaningful business actions
Statistically, ads with CTR above 1.5% tend to reduce CPC by 20–30% due to platform relevance scoring. If CTR drops while CPM stays stable, the issue is usually creative, not targeting.
Action signals:
-
Falling CTR + stable reach → refresh creatives or messaging
-
Low CTR across all audiences → revisit offer clarity and value proposition
3. Conversion Metrics: Is Traffic Turning Into Results?
These metrics determine whether the campaign contributes to business goals.
Key metrics to monitor:
-
Conversion rate
-
CPA (Cost per acquisition)
-
ROAS (Return on ad spend)
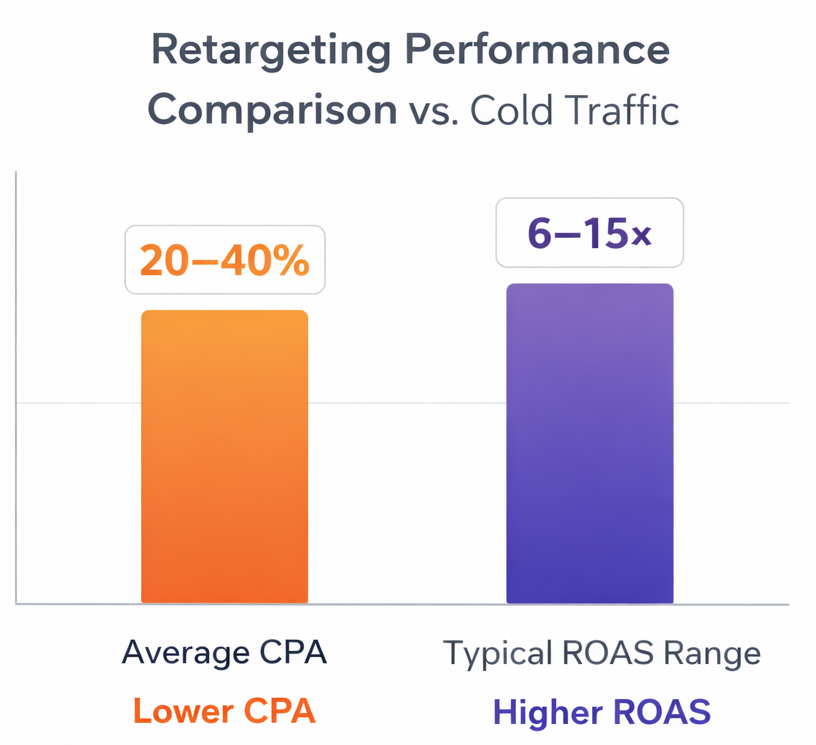
Retargeting campaigns often deliver lower cost-per-acquisition (CPA) and significantly higher return on ad spend (ROAS) compared to cold traffic campaigns
Data from performance campaigns consistently shows that retargeting traffic converts 2–3 times higher than cold traffic. If conversion rates are low across both, the bottleneck is often the landing page, not the ad.
Action signals:
-
High CTR + low conversion rate → optimize landing page experience
-
Rising CPA with stable conversion rate → investigate audience quality
Reading Metrics in Combination (Not Isolation)
Single metrics rarely tell the full story. The real insights appear when metrics are read together.
Examples:
-
High CTR + high CPA → strong message, weak audience quality
-
Low CTR + low CPM → cheap reach, poor creative relevance
-
Stable CTR + rising CPA → post-click friction or offer mismatch
This layered analysis prevents premature changes, such as killing good ads or scaling inefficient audiences.
Turning Reports Into a Weekly Action Plan
Instead of daily micro-adjustments, use reports to define structured actions.
Weekly review framework:
-
Identify the weakest metric layer (exposure, engagement, or conversion)
-
Make one primary change per layer (audience, creative, or funnel)
-
Let changes run long enough to gather statistically meaningful data
Marketers who follow weekly optimization cycles report up to 25% more consistent CPA stability compared to those making daily changes.
Common Reporting Mistakes to Avoid
-
Optimizing for CTR without checking conversion quality
-
Scaling spend based on short-term ROAS spikes
-
Comparing audiences with significantly different spend levels
-
Ignoring frequency until performance collapses
Metrics should guide decisions, not dictate emotional reactions.
What to Read Next
To deepen your understanding of performance analysis and targeting decisions, explore these related articles:
-
How to Make High-Quality Facebook Ad Creatives Without Breaking the Bank
-
How to Track Facebook Ads Performance Without Getting Lost in the Data
Final Thought
Ad reports are not scorecards—they are diagnostic tools. When metrics are grouped, compared, and interpreted correctly, they reveal exactly where to act and what to fix. The difference between average and high-performing campaigns is rarely more data, but better decisions based on the data already available.