Marketing funnels rarely fail all at once. More often, inefficiencies build gradually—hidden in cost patterns that go unnoticed until performance drops significantly. Detecting funnel imbalance early allows teams to reallocate resources, improve conversion rates, and maximize ROI.
This guide explains how to identify funnel imbalance by analyzing cost behavior across each stage of your funnel.
What Is Funnel Imbalance?
Funnel imbalance occurs when one or more stages of your marketing or sales funnel underperform relative to the others. This creates inefficiencies such as overspending on acquisition, poor lead quality, or low conversion rates further down the funnel.
A balanced funnel maintains proportional cost efficiency from top-of-funnel (TOFU) awareness through middle-of-funnel (MOFU) nurturing to bottom-of-funnel (BOFU) conversion.
Why Cost Patterns Matter
Cost patterns provide a quantitative lens into funnel performance. While conversion rates and engagement metrics are useful, cost data reveals where money is being wasted.
According to industry benchmarks:
-
Companies lose up to 30% of their marketing budget due to funnel inefficiencies.
-
The average B2B conversion rate from lead to customer is only 2–5%.
-
Acquisition costs can increase by over 50% when funnel misalignment goes unaddressed.
Monitoring cost patterns allows you to identify these issues before they scale.
Key Cost Metrics to Track
To detect imbalance, focus on cost distribution across funnel stages:
1. Cost Per Lead (CPL)
A rising CPL often signals inefficiencies at the top of the funnel, such as poor targeting or low-quality traffic.
2. Cost Per Marketing Qualified Lead (CPMQL)
If CPMQL is significantly higher than CPL, it indicates that many leads are not progressing—suggesting weak lead qualification or messaging misalignment.
3. Cost Per Sales Qualified Lead (CPSQL)
A spike in CPSQL typically points to breakdowns in nurturing or scoring processes.
4. Customer Acquisition Cost (CAC)
CAC reflects the cumulative efficiency of your entire funnel. A sudden increase often signals imbalance in one or more earlier stages.
Identifying Imbalance Through Cost Ratios
Rather than looking at metrics in isolation, analyze ratios between them:
-
CPL to CAC ratio
-
CPL to CPSQL ratio
-
CPMQL to CPSQL ratio
For example, if CPL remains stable but CAC increases, the issue likely lies in mid-to-bottom funnel conversion.
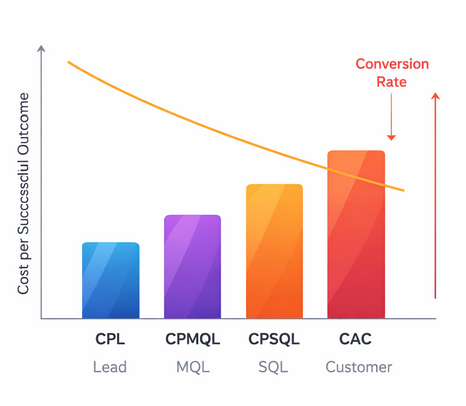
Rising costs combined with declining conversion rates signal funnel imbalance and inefficient budget allocation
A healthy funnel maintains relatively stable ratios over time. Sudden deviations indicate imbalance.
Common Funnel Imbalance Patterns
High TOFU Spend, Low Conversion
Symptoms:
-
Increasing CPL
-
Stable or declining MQL rate
-
Rising CAC
Cause:
-
Poor audience targeting or irrelevant traffic sources
Strong Lead Volume, Weak Qualification
Symptoms:
-
Low CPMQL to CPL conversion
-
High CPSQL
Cause:
-
Ineffective lead scoring or messaging misalignment
Bottleneck in Sales Stage
Symptoms:
-
Stable CPSQL but rising CAC
-
Declining close rates
Cause:
-
Sales process inefficiencies or poor lead handoff
Over-Optimized Lower Funnel
Symptoms:
-
Low CAC but declining lead volume
Cause:
-
Underinvestment in top-of-funnel activities
How to Diagnose Funnel Imbalance Step by Step
Step 1: Map Cost Distribution
Break down total spend across funnel stages and calculate cost per stage.
Step 2: Compare Conversion Efficiency
Analyze conversion rates alongside cost metrics to identify mismatches.
Step 3: Track Trends Over Time
Look for gradual increases in cost metrics rather than isolated spikes.
Step 4: Segment by Channel
Different channels may contribute differently to imbalance. Compare paid search, social, and outbound channels.
Step 5: Align Cost With Revenue
Ultimately, every stage should contribute to revenue generation. If costs increase without proportional revenue growth, imbalance exists.
Practical Tips to Restore Balance
-
Reallocate budget toward high-performing channels and stages
-
Improve targeting to reduce wasted acquisition spend
-
Refine lead qualification criteria
n- Strengthen alignment between marketing and sales teams -
Continuously monitor cost ratios, not just absolute values
Conclusion
Funnel imbalance is not always obvious—but cost patterns rarely lie. By systematically analyzing how costs evolve across each stage, you can uncover hidden inefficiencies, prevent budget waste, and maintain a high-performing funnel.
Organizations that actively monitor and optimize cost patterns gain a significant competitive advantage, achieving better conversion rates and lower acquisition costs over time.