Organizations today collect more data than ever before. According to IDC, global data volume surpassed 120 zettabytes in 2023 and continues to grow at double-digit annual rates. Yet volume alone does not create value. The real advantage lies in identifying the specific subsets of customers, accounts, or behaviors that generate the highest return.
High-value segmentation enables companies to:
-
Increase marketing ROI
-
Improve customer acquisition efficiency
-
Reduce churn
-
Allocate sales resources more effectively
-
Prioritize product development initiatives
Research from McKinsey shows that companies using advanced segmentation strategies can improve marketing ROI by 15–30% and increase revenue by up to 10%. The difference between average and top-performing organizations is often their ability to extract signal from noise.
This article outlines a structured framework for identifying high-value segments in large datasets.
Step 1: Define "High Value" with Precision
Before analyzing data, define what "high value" means for your organization. This definition should be quantitative and tied directly to business outcomes.
Common definitions include:
-
Highest lifetime value (LTV)
-
Highest annual contract value (ACV)
-
Highest profit margin
-
Lowest churn probability
-
Fastest sales cycle velocity
-
Highest expansion or upsell rate
For B2B teams, high value often correlates with a combination of firmographic attributes (industry, company size, region) and behavioral signals (engagement level, buying intent, product usage).
Avoid vague definitions. Instead of "good customers," define thresholds such as:
-
Top 20% by revenue contribution
-
Accounts with LTV above $50,000
-
Customers with retention greater than 24 months
Clarity at this stage ensures analytical consistency.
Step 2: Consolidate and Normalize Data
Large datasets often contain inconsistencies, duplicates, and missing values. According to Gartner, poor data quality costs organizations an average of $12.9 million annually.
Before segmentation:
-
Remove duplicate records
-
Standardize categorical variables (industry labels, job titles, company sizes)
-
Normalize numeric fields
-
Fill or flag missing values
-
Validate key identifiers
Data normalization prevents skewed analysis and false segmentation patterns.
Step 3: Start with Revenue Distribution Analysis
A practical starting point is Pareto analysis. In many industries, the 80/20 principle applies: 20% of customers generate 80% of revenue.
To conduct a revenue distribution analysis:
-
Rank customers by total revenue or LTV.
-
Calculate cumulative revenue contribution.
-
Identify the top percentile contributing the majority of revenue.
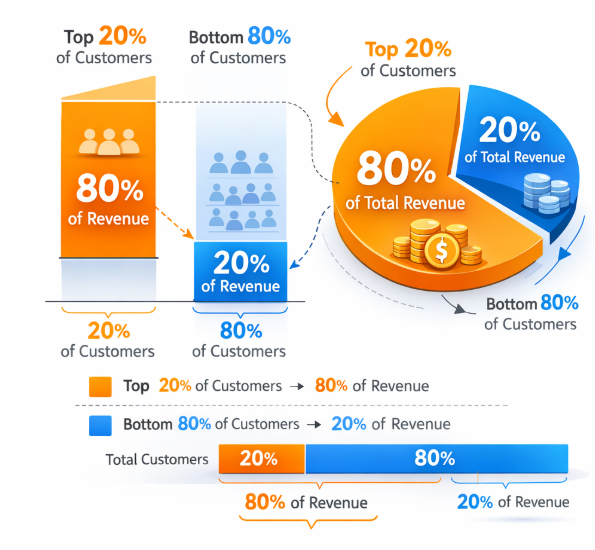
Revenue Concentration Across Customer Base: The top 20% of customers often generate roughly 80% of total revenue, illustrating the value of prioritizing high-value segments
This group becomes your initial "high-value" cluster. The next objective is to determine what characteristics define this group.
Step 4: Apply Multi-Dimensional Segmentation
High-value segments rarely emerge from a single variable. Instead, they result from the intersection of multiple attributes.
Key segmentation dimensions include:
1. Firmographic Variables
-
Industry vertical
-
Company size (employees or revenue)
-
Geographic region
-
Growth rate
2. Behavioral Variables
-
Product usage frequency
-
Feature adoption rate
-
Engagement score
-
Response time
3. Transactional Variables
-
Purchase frequency
-
Average order value
-
Renewal rate
-
Upsell ratio
Using clustering algorithms such as k-means, hierarchical clustering, or density-based methods can reveal naturally occurring groupings in large datasets.
In practice, combining statistical clustering with domain expertise produces the strongest results.
Step 5: Identify Statistical Significance
After isolating a potential high-value segment, validate that its performance is statistically significant.
Key validation steps include:
-
Compare average revenue per account against overall average
-
Conduct hypothesis testing
-
Evaluate confidence intervals
-
Check sample size adequacy
For example, if a segment representing 12% of your dataset delivers 35% of total revenue, this indicates a strong concentration effect. However, confirm that this pattern is consistent over time and not driven by outliers.
Consistency across multiple quarters strengthens the case for segment prioritization.
Step 6: Evaluate Predictive Variables
Once high-value segments are identified, determine which variables predict membership in that segment.
Methods include:
-
Logistic regression
-
Decision trees
-
Random forests
-
Gradient boosting models
Feature importance scores help isolate the most influential predictors.
For example:
-
Companies with 200–1000 employees may have 2.5× higher LTV.
-
Accounts in a specific vertical may show 40% lower churn.
-
High product usage in the first 30 days may correlate with 3× retention.
These predictive markers can be used to refine targeting strategies.
Step 7: Operationalize the Segment
Identifying high-value segments is only valuable if translated into operational strategy.
Applications include:
-
Prioritized outbound prospecting lists
-
Tiered account-based marketing campaigns
-
Customized onboarding workflows
-
Dedicated customer success resources
-
Dynamic pricing strategies
Organizations that align segmentation insights with sales and marketing execution consistently outperform competitors.
Step 8: Continuously Recalculate
High-value segments evolve over time. Market conditions, product changes, and competitive shifts alter performance dynamics.
Best practices include:
-
Quarterly segmentation recalculations
-
Monitoring LTV and churn trends
-
Revalidating predictive variables
-
Tracking segment-level ROI
Continuous refinement prevents strategic drift.
Common Pitfalls to Avoid
-
Over-segmentation: Creating too many micro-segments reduces operational clarity.
-
Correlation confusion: Not all patterns imply causation.
-
Ignoring margin: Revenue alone does not equal profitability.
-
Static analysis: Failing to update segmentation regularly.
-
Data silos: Excluding behavioral or engagement data limits insight depth.
Strategic segmentation balances analytical rigor with practical usability.
Conclusion
High-value segment identification transforms raw data into strategic advantage. By combining revenue analysis, multi-dimensional segmentation, statistical validation, and predictive modeling, organizations can focus resources where they produce the highest return.
In an environment where data volume continues to expand rapidly, competitive advantage belongs to teams that convert complexity into clarity.