Marketing funnels exist because people do not make purchase decisions instantly. They move through stages of awareness, consideration, and decision, each requiring different information and levels of trust.
When audiences are mismatched to funnel stages, campaigns tend to suffer from low engagement, high acquisition costs, and wasted budget. By contrast, brands that tailor audiences and messages to funnel intent consistently outperform generic campaigns.
Industry data shows:
-
Businesses using segmented funnel-based campaigns report up to 73% higher conversion rates compared to non-segmented approaches.
-
Ads aligned with user intent can reduce cost per acquisition by 30–40%.
These improvements are not driven by better creatives alone, but by delivering the right message to the right audience at the right stage.
The Three Core Funnel Stages
While funnels can be modeled in many ways, most digital advertising strategies rely on three core stages: Top of Funnel (TOF), Middle of Funnel (MOF), and Bottom of Funnel (BOF).
Top of Funnel: Awareness
Goal: Introduce your brand or solution to new audiences.
Audience Characteristics:
-
Little to no prior interaction with your brand
-
Broad interests or behaviors related to your market
-
Problem-aware or curiosity-driven
Best Audience Types:
-
Interest-based audiences
-
Broad lookalikes (5–10%)
-
Contextual or demographic segments
Effective Content:
-
Educational videos
-
Problem-focused messaging
-
High-level benefits rather than features
On average, awareness-stage campaigns generate 3–5x more reach than lower-funnel campaigns, but conversions are typically low. This is expected and healthy when the goal is exposure and data collection.
Middle of Funnel: Consideration
Goal: Build trust and evaluate intent.
Audience Characteristics:
-
Familiar with your brand
-
Engaged with content or ads
-
Actively comparing solutions
Best Audience Types:
-
Website visitors (last 30–180 days)
-
Video viewers (25–75%)
-
Engagement-based custom audiences
-
Narrow lookalikes (1–3%)
Effective Content:
-
Product explainers
-
Case studies or testimonials
-
Lead magnets and demos

Segmented audiences outperform non-segmented, with higher open and click engagement rates
Research indicates that retargeted MOF audiences convert 2–3x higher than cold traffic while maintaining significantly lower acquisition costs.
Bottom of Funnel: Conversion
Goal: Drive action and close the sale.
Audience Characteristics:
-
High intent
-
Repeated interactions
-
Close to making a purchase decision
Best Audience Types:
-
Cart or checkout visitors
-
Pricing page visitors
-
CRM or customer lists
Effective Content:
-
Strong value propositions
-
Social proof and urgency
-
Clear calls to action
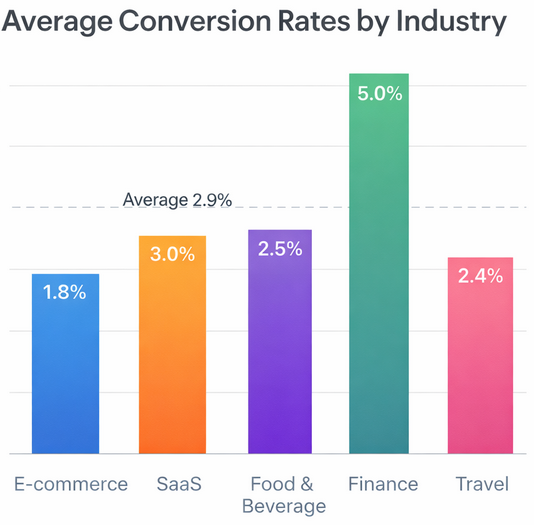
Conversion rate benchmarks across industries highlight typical conversion performance and differences by sector
Well-optimized BOF campaigns often achieve conversion rates up to 5x higher than awareness campaigns, making them critical for short-term revenue.
How to Map Audiences to Funnel Stages
Step 1: Inventory Your Data Sources
Start by identifying all available data points:
-
Website traffic and page-level behavior
-
Ad engagement (video views, clicks, saves)
-
Lead and customer data
The more accurately these signals are grouped, the easier it becomes to assign funnel stages.
Step 2: Define Clear Entry and Exit Rules
Each funnel stage should have clear logic:
-
What qualifies someone to enter this stage?
-
What action moves them to the next stage?
For example, a user might move from TOF to MOF after watching 50% of a video or visiting a key product page.
Step 3: Align Messaging and Budget Allocation
Audience mapping only works when budget and creative strategy follow the funnel structure.
Typical budget distribution benchmarks:
-
40–50% on TOF for reach and data
-
30–40% on MOF for engagement and leads
-
10–20% on BOF for conversions
Brands that rebalance spend based on funnel performance report up to 25% higher return on ad spend.
Common Audience Mapping Mistakes
-
Treating all retargeting audiences as BOF
-
Using the same creative across all funnel stages
-
Pushing conversion offers too early
-
Ignoring audience fatigue and recency windows
Avoiding these mistakes ensures that audiences progress naturally instead of dropping out due to mismatched expectations.
Measuring Funnel Performance
Track funnel-specific metrics rather than relying on a single KPI:
-
TOF: Reach, video completion rate, CPM
-
MOF: Click-through rate, engagement, lead cost
-
BOF: Conversion rate, CPA, revenue
Companies that monitor funnel-stage metrics separately are 42% more likely to identify scaling opportunities early.
Suggested Reading
To deepen your understanding of audience strategy and performance optimization, explore these related articles:
Final Thoughts
Mapping audiences to funnel stages is not a one-time setup. It is an ongoing process that evolves with user behavior, creative performance, and market conditions. When done correctly, it transforms advertising from a guessing game into a predictable growth system.