
Modern marketing and sales teams are drowning in data. Dashboards refresh every minute, spreadsheets grow endlessly, and stakeholders demand more metrics each quarter. Yet despite this abundance, decision-making often slows down instead of speeding up.
The problem is not a lack of data. It is the inability to distinguish signal (information that should influence decisions) from noise (data that looks important but has little or no impact).
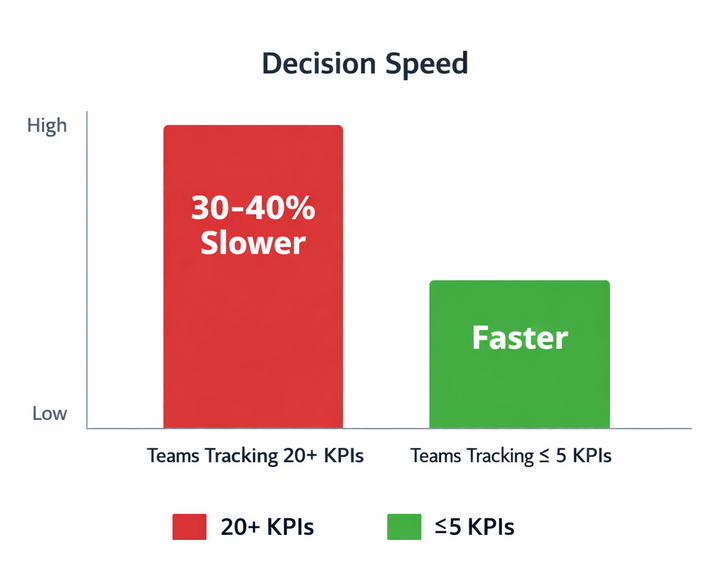
According to industry research, teams that track more than 20 KPIs are 30–40% slower at making decisions compared to teams focused on a smaller, prioritized metric set. More numbers rarely lead to better outcomes; clearer numbers do.
Step 1: Start With the Decision, Not the Data
Every report should exist to support a specific decision. If a metric does not influence an action, it does not belong in the report.
Before opening a dashboard or spreadsheet, ask:
-
What decision will this report support?
-
Who is responsible for acting on it?
-
What action should change if the numbers move up or down?
Studies in performance management show that reports designed around a single decision reduce meeting time by up to 25% and increase follow-through on action items.
Step 2: Limit Metrics to What Actually Moves Results
High-performing teams deliberately restrict the number of metrics they monitor. A common best practice is the 3–5 metric rule per report.
Useful metrics share three characteristics:
-
They are directly tied to revenue, growth, or efficiency
-
They change frequently enough to prompt action
-
They have a clear owner
In contrast, vanity metrics (impressions, raw traffic, total followers) often dominate reports despite having weak correlation with outcomes. One analysis across digital campaigns found that removing vanity metrics improved forecast accuracy by over 20%.
Step 3: Use Comparisons, Not Isolated Numbers
A number without context is noise.
Effective reports rely on comparisons:
-
Period over period (week vs. week, month vs. month)
-
Segment vs. segment
-
Expected vs. actual
For example, conversion rate alone tells little. Conversion rate compared to last month, or compared across audience segments, reveals patterns that matter.
Data visualization research shows that comparative charts improve insight recognition by nearly 2× compared to single-value tables.
Step 4: Segment Ruthlessly
Averages hide signals.
When data is aggregated, meaningful differences disappear. Segmenting by audience, funnel stage, channel, or behavior often exposes the insights that drive growth.
In marketing analytics, segmented reports consistently outperform aggregated ones. Teams that analyze segmented performance are 60% more likely to identify profitable opportunities early.
If a report does not allow you to answer “which group is driving this result?”, it is incomplete.
Step 5: Highlight Change, Not Status
Static numbers create passive reading. Change creates urgency.
Strong reports emphasize:
-
Trends
-
Spikes and drops
-
Deviations from normal ranges
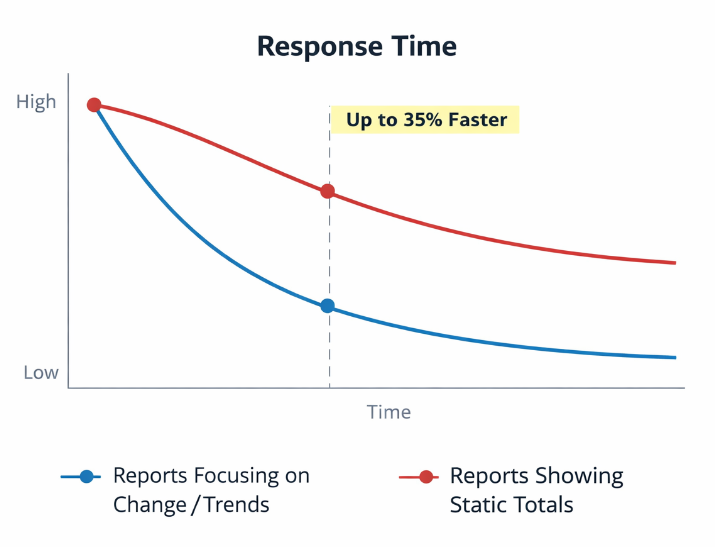
Using indicators such as percentage change or trend direction makes it immediately clear where attention is required. Reports that focus on change rather than totals improve response time by up to 35% in fast-moving teams.
Step 6: Remove Data That No One References
One of the most effective optimizations is subtraction.
If a metric has not been discussed, questioned, or acted on in the last reporting cycle, it is likely noise. Regular report audits help keep dashboards lean and relevant.
Organizations that review and simplify reports quarterly reduce reporting time by 20–30% while increasing stakeholder satisfaction.
Turning Reports Into Decision Engines
Separating signal from noise is not about advanced analytics or complex tools. It is about discipline:
-
Start with the decision
-
Focus on a few meaningful metrics
-
Compare, segment, and highlight change
-
Remove everything that does not drive action
When reports are designed this way, they stop being passive summaries and become active decision engines.
Recommended Reading
To deepen your understanding of data-driven decision-making, consider these related articles: