A/B testing is widely used in paid acquisition, yet a large share of tests lead to misleading conclusions. The main reason is not a lack of data, but poor structure. Common issues include testing too many variables at once, stopping tests too early, or drawing conclusions from statistically weak samples.

58% of companies use A/B testing for conversion rate optimization, showing that experiment-driven decisions are a standard practice in digital marketing
Industry benchmarks show that over 60% of paid media A/B tests are inconclusive due to insufficient sample size or premature termination. In other words, most advertisers are spending budget without gaining reliable learning.
Step 1: Define a Single, Testable Hypothesis
Every A/B test should start with a clear hypothesis that focuses on one change and one expected outcome.
A strong hypothesis follows this structure:
If we change X, then Y will improve because Z.
Examples:
-
If we use a shorter headline, then click-through rate will increase because the message is easier to process.
-
If we narrow the audience definition, then cost per conversion will decrease because relevance will improve.
Avoid vague goals such as “see what works better.” Without a hypothesis, results cannot be interpreted reliably.
Step 2: Test One Variable at a Time
To isolate cause and effect, each test should change only one variable:
-
Creative (image, video, headline)
-
Audience definition
-
Placement or format
-
Landing page element
When multiple variables are changed at once, you may see performance differences—but you will not know why they occurred. Controlled testing ensures that insights can be reused in future campaigns.
Step 3: Ensure Proper Sample Size
Statistical reliability depends on volume. Tests that end after a few conversions often produce false winners.
As a general rule:
-
Aim for at least 100 conversions per variant for conversion-focused tests
-
For click-through rate tests, each variant should receive at least 1,000–2,000 impressions
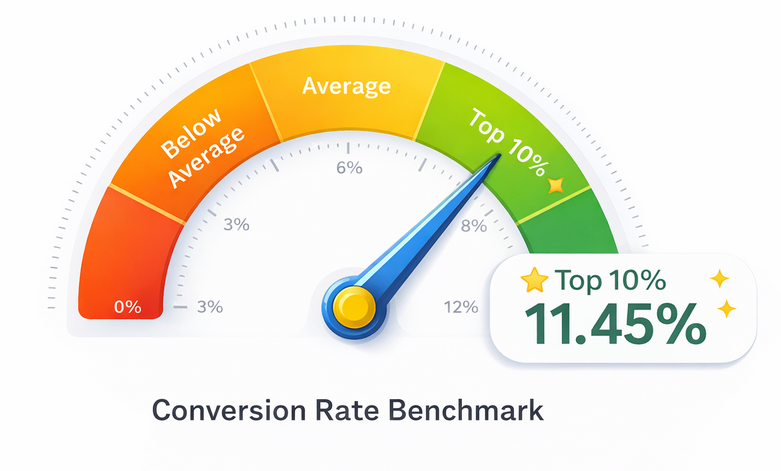
The top 10% of advertisers achieve an 11.45% conversion rate, underscoring the impact of effective testing and optimization
Data from large-scale ad accounts shows that tests with fewer than 50 conversions per variant have a false-positive rate above 30%, meaning nearly one in three “wins” is incorrect.
Step 4: Split Traffic Evenly and Consistently
Traffic distribution should be as close to 50/50 as possible between variants. Uneven delivery introduces bias, especially when platform algorithms optimize toward early performance signals.
Key practices:
-
Launch variants at the same time
-
Use identical budgets and schedules
-
Avoid mid-test edits, which reset learning and distort results
Consistency is critical to ensure both variants compete under the same conditions.
Step 5: Let Tests Run Long Enough
Paid traffic performance fluctuates by day of week, time of day, and auction dynamics. Ending tests too early often captures short-term volatility instead of true performance.
Recommended minimum duration:
-
7 days for most paid traffic tests
-
14 days for lower-volume campaigns
Studies across multiple ad platforms show that conversion rates can vary by 20–30% depending on the day of the week alone, making shorter tests unreliable.
Step 6: Choose the Right Success Metric
Every test should have one primary success metric. Common choices include:
-
Cost per conversion
-
Conversion rate
-
Click-through rate
-
Return on ad spend
Secondary metrics can provide context, but decisions should be based on the primary metric defined before launch. Changing the success metric after seeing results introduces confirmation bias.
Step 7: Analyze Results with Statistical Confidence
When a test ends, compare results using statistical significance rather than percentage differences alone.
For example:
-
A 12% lower cost per conversion may look meaningful
-
But without statistical confidence, the result could still be random variation
Advertisers who apply statistical validation report 20–25% higher long-term performance gains, because decisions are based on repeatable outcomes rather than luck.
Step 8: Document and Reuse Learnings
Every completed test should produce a documented insight, regardless of outcome:
-
What was tested
-
What changed
-
What the result was
-
Whether the hypothesis was confirmed or rejected
This creates a testing library that compounds over time. Teams that systematically document tests run 30–40% fewer redundant experiments and scale faster with less wasted budget.
Common A/B Testing Mistakes to Avoid
-
Stopping tests after a few conversions
-
Testing multiple variables in one experiment
-
Ignoring statistical significance
-
Optimizing mid-test
-
Declaring winners based on short-term performance spikes
Avoiding these mistakes is often more impactful than running more tests.
Final Thoughts
Reliable A/B testing is not about running more experiments—it is about running better ones. By structuring tests around clear hypotheses, sufficient data, and statistical discipline, paid traffic becomes a predictable growth channel rather than a guessing game.
Over time, this approach turns testing into a strategic advantage, enabling confident scaling and consistent performance improvements.
Recommended Reading
To deepen your understanding of paid traffic optimization, explore these related articles on our blog: