
Sudden drops in advertising or marketing performance are rarely random. In most cases, they are tied to changes in data quality, tracking integrity, or audience signals. According to industry research, more than 40% of performance declines are linked to tracking or attribution issues rather than creative or bidding problems. A structured data review allows teams to restore stability faster and make informed optimization decisions.
This article provides a practical data checklist marketers can use when performance declines across paid media, lead generation, or conversion-focused campaigns.
Step 1: Verify Tracking and Attribution
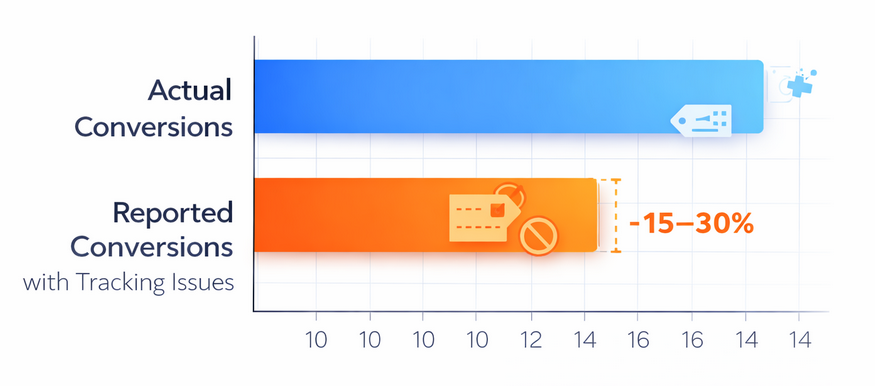
Tracking errors can underreport conversions by 15–30%, leading to misleading performance insights
Before adjusting budgets or creatives, confirm that data is being collected accurately.
Checklist:
-
Confirm pixels, tags, and SDKs are firing correctly
-
Check for recent changes to consent banners or cookie policies
-
Review attribution windows for unexpected changes
-
Compare platform-reported conversions with backend or CRM data
Why it matters:
Studies show that incorrect or broken tracking can underreport conversions by 15–30%, leading to unnecessary optimization decisions.
Step 2: Check Data Volume and Signal Loss
Algorithm-driven platforms rely on sufficient data volume. A drop in events can weaken optimization signals.
Checklist:
-
Review daily and weekly event volume trends
-
Identify sudden drops in impressions, clicks, or conversions
-
Confirm no exclusions were added to key audiences
-
Check for frequency caps or delivery limitations
Key statistic:

Campaigns that fall below recommended conversion thresholds often see efficiency decline by 20–35% within two weeks.
Step 3: Analyze Audience Quality Shifts
Performance drops often occur when audience composition changes—even if targeting settings remain the same.
Checklist:
-
Compare audience size and growth trends
-
Review overlap between prospecting and retargeting segments
-
Identify saturation or fatigue in high-frequency audiences
-
Check for reduced engagement rates from core segments
Data insight:
Audience fatigue typically appears after frequency exceeds 3–4 impressions per user, with click-through rates declining by an average of 25%.
Step 4: Review Conversion Funnel Metrics
Top-line performance hides where the real issue occurs. Funnel-level data reveals where users drop off.
Checklist:
-
Compare click-to-landing-page view rates
-
Review form completion or checkout abandonment
-
Analyze time-to-conversion changes
-
Segment performance by device and location
Benchmark reference:
Landing page load delays of just one second can reduce conversion rates by up to 7%, significantly impacting overall results.
Step 5: Validate Creative and Placement Data
Creative fatigue or poor placement alignment can quietly erode performance.
Checklist:
-
Review engagement metrics by creative variant
-
Identify creatives with declining CTR over time
-
Compare performance across placements and formats
-
Confirm that new creatives are receiving sufficient delivery
Performance note:
Refreshing creatives every 3–4 weeks has been shown to improve click-through rates by 10–20% in competitive verticals.
Step 6: Compare Against Historical Benchmarks
Context matters. Short-term fluctuations should be evaluated against long-term data.
Checklist:
-
Compare current metrics to 30-, 60-, and 90-day averages
-
Account for seasonality and promotional cycles
-
Review year-over-year performance where applicable
-
Isolate anomalies from consistent downward trends
Insight:
Marketers who use rolling historical benchmarks identify performance issues up to 40% faster than those relying on single-date comparisons.
Step 7: Confirm Data Consistency Across Tools
Conflicting reports often signal deeper data integrity issues.
Checklist:
-
Compare metrics across ad platforms, analytics tools, and CRM systems
-
Align event definitions and naming conventions
-
Check for timezone mismatches
-
Validate deduplication rules
Industry data:
Inconsistent reporting across tools can inflate or deflate performance metrics by 10–25%, masking real optimization opportunities.
Common Data Red Flags to Act On Immediately
-
Sudden conversion drops without traffic changes
-
Stable CTR but declining conversion rates
-
Rising costs with flat engagement metrics
-
Major discrepancies between platform and backend data
Addressing these signals early can prevent prolonged inefficiencies and wasted spend.
Related Articles You May Find Useful
Conclusion
Performance drops are rarely caused by a single factor. A disciplined data checklist helps marketers move beyond guesswork and identify the exact source of decline. By validating tracking, monitoring audience signals, and benchmarking against historical data, teams can restore performance faster and make smarter optimization decisions grounded in reliable insights.