
Incrementality testing is one of the most reliable methods for determining whether a marketing activity truly drives additional outcomes or simply captures conversions that would have happened anyway. While the concept is straightforward—compare a group exposed to a campaign with a control group that is not—interpreting the results often becomes confusing once statistical terms enter the discussion.
Marketing teams frequently encounter metrics such as lift, statistical significance, confidence intervals, and variance. Without a clear framework for reading these indicators, it becomes easy to draw the wrong conclusions from otherwise well‑designed experiments. The purpose of this article is to break down incrementality test results into practical components so that marketers can make confident decisions based on the data.
What Incrementality Testing Measures
Incrementality testing determines the causal impact of a campaign by measuring the difference between two groups:
-
Test group: audience exposed to the campaign
-
Control group: similar audience that does not see the campaign
If the test group produces more conversions than the control group, the difference represents the incremental impact.
For example, imagine a campaign where:
-
Test group conversion rate: 4.8%
-
Control group conversion rate: 3.9%
The incremental lift is 0.9 percentage points, meaning the campaign generated additional conversions that would not have occurred otherwise.
Incrementality tests are widely used across digital advertising channels. According to industry research, nearly 65% of enterprise marketing teams now run some form of controlled experimentation to validate campaign effectiveness. However, fewer than 40% report high confidence in interpreting experimental outcomes, highlighting the need for clearer frameworks.
Understanding Lift Without Misinterpretation
Lift is the most visible metric in incrementality reports, but it is also the one most frequently misunderstood.
Lift measures the relative improvement of the test group over the control group. It is calculated as:
Incremental Lift = (Test Rate − Control Rate) / Control Rate
Using the earlier example:
(4.8 − 3.9) / 3.9 = 23.1% lift
This means the campaign increased conversions by 23.1% relative to what would have happened without it.
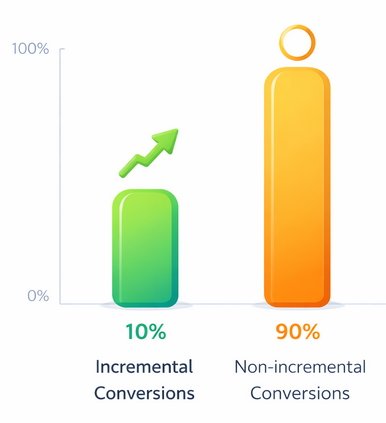
Example of Low Incrementality — A campaign showing 10% incremental lift means the majority of conversions would likely occur even without the ads
A common mistake is focusing on lift without considering the base conversion rate. A campaign that raises conversions from 0.1% to 0.15% shows 50% lift, but the actual business impact may still be small. Conversely, a 10% lift on a high baseline conversion rate can produce much larger revenue gains.
Therefore, lift should always be interpreted alongside absolute conversion differences and total volume.
The Role of Statistical Significance
Statistical significance indicates whether the observed difference between the test and control groups is likely the result of the campaign rather than random variation.
In most marketing experiments, a 95% confidence level is used as the threshold for statistical significance. This means there is only a 5% probability that the observed result occurred by chance.
However, significance does not measure the size or importance of the effect. A campaign can produce statistically significant results that are economically insignificant if the lift is too small to justify the cost.
Research from large‑scale advertising experiments shows that over 30% of statistically significant campaign tests still fail to generate positive ROI, emphasizing that significance alone should never drive decisions.
Why Sample Size Matters
One of the most common causes of confusing incrementality results is insufficient sample size.
When the number of observations is too small, random variation can dominate the outcome. This leads to unstable metrics and wide confidence intervals.
Consider two experiments:
| Test Size | Observed Lift | Confidence Reliability |
|---|---|---|
| 2,000 users | 30% lift | Low reliability |
| 200,000 users | 12% lift | High reliability |
Although the first experiment shows higher lift, the second is far more trustworthy because the larger sample reduces noise.
Statistical power analysis often suggests that incrementality experiments require tens of thousands of observations per group to produce reliable conclusions, particularly when expected lift is below 20%.
Interpreting Confidence Intervals
Confidence intervals show the range within which the true incremental effect likely falls.
For example, an experiment may report:
Incremental lift: 18%
Confidence interval: 8% – 27%
This means the real impact of the campaign likely lies somewhere between 8% and 27%. The wider the interval, the greater the uncertainty.
A useful rule for marketers is:
-
Narrow intervals indicate stable and reliable results.
-
Wide intervals suggest the test needs more data or a longer runtime.
Ignoring confidence intervals is a common mistake that leads to overconfidence in early results.
Distinguishing Incremental Impact From Attribution
Another source of confusion is mixing incrementality with attribution metrics.
Attribution models assign credit to marketing touchpoints based on observed interactions, but they do not necessarily measure causality. Incrementality experiments, on the other hand, isolate the causal effect by comparing exposed and unexposed audiences.
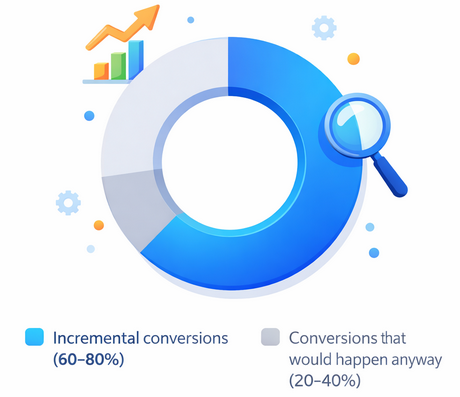
Why Incrementality Testing Matters — A significant share of conversions attributed to marketing may have occurred even without the campaign
Studies comparing attribution data with controlled experiments have found that up to 30–50% of conversions credited to advertising may have occurred without the campaign. This discrepancy highlights why incrementality testing is critical for accurate performance evaluation.
Translating Results Into Decisions
Once incrementality results are understood, the final step is converting them into actionable decisions.
A simple decision framework includes three questions:
-
Is the result statistically reliable?
-
Is the incremental impact economically meaningful?
-
Can the campaign scale without degrading performance?
For instance, if a campaign produces a 15% statistically significant lift with strong ROI, scaling investment may be justified. If the lift is small or uncertain, the better strategy may be to refine targeting or messaging before expanding spend.
Data‑driven marketing organizations increasingly rely on experimentation as a core decision system. According to industry surveys, companies that adopt structured testing frameworks are 30–40% more likely to outperform competitors in campaign efficiency.
Conclusion
Incrementality testing provides one of the clearest ways to measure whether marketing truly drives additional outcomes. However, interpreting the results requires more than simply reading a lift percentage.
By understanding the relationship between lift, statistical significance, sample size, and confidence intervals, marketers can avoid common analytical pitfalls and make better decisions based on experimental evidence.
Clear interpretation transforms incrementality testing from a statistical exercise into a practical tool for improving marketing effectiveness and allocating budget with confidence.