Launching a new campaign on Facebook feels urgent. Data starts flowing within hours, and the instinct is to react fast. Most advertisers either panic too early or wait too long. A structured 72-hour review window removes emotion from the process and forces disciplined analysis.
This framework explains what to evaluate at 24, 48, and 72 hours. It focuses on signal quality, not vanity metrics. The goal is to decide whether to scale, iterate, or shut down based on evidence.
Why the First 72 Hours Matter
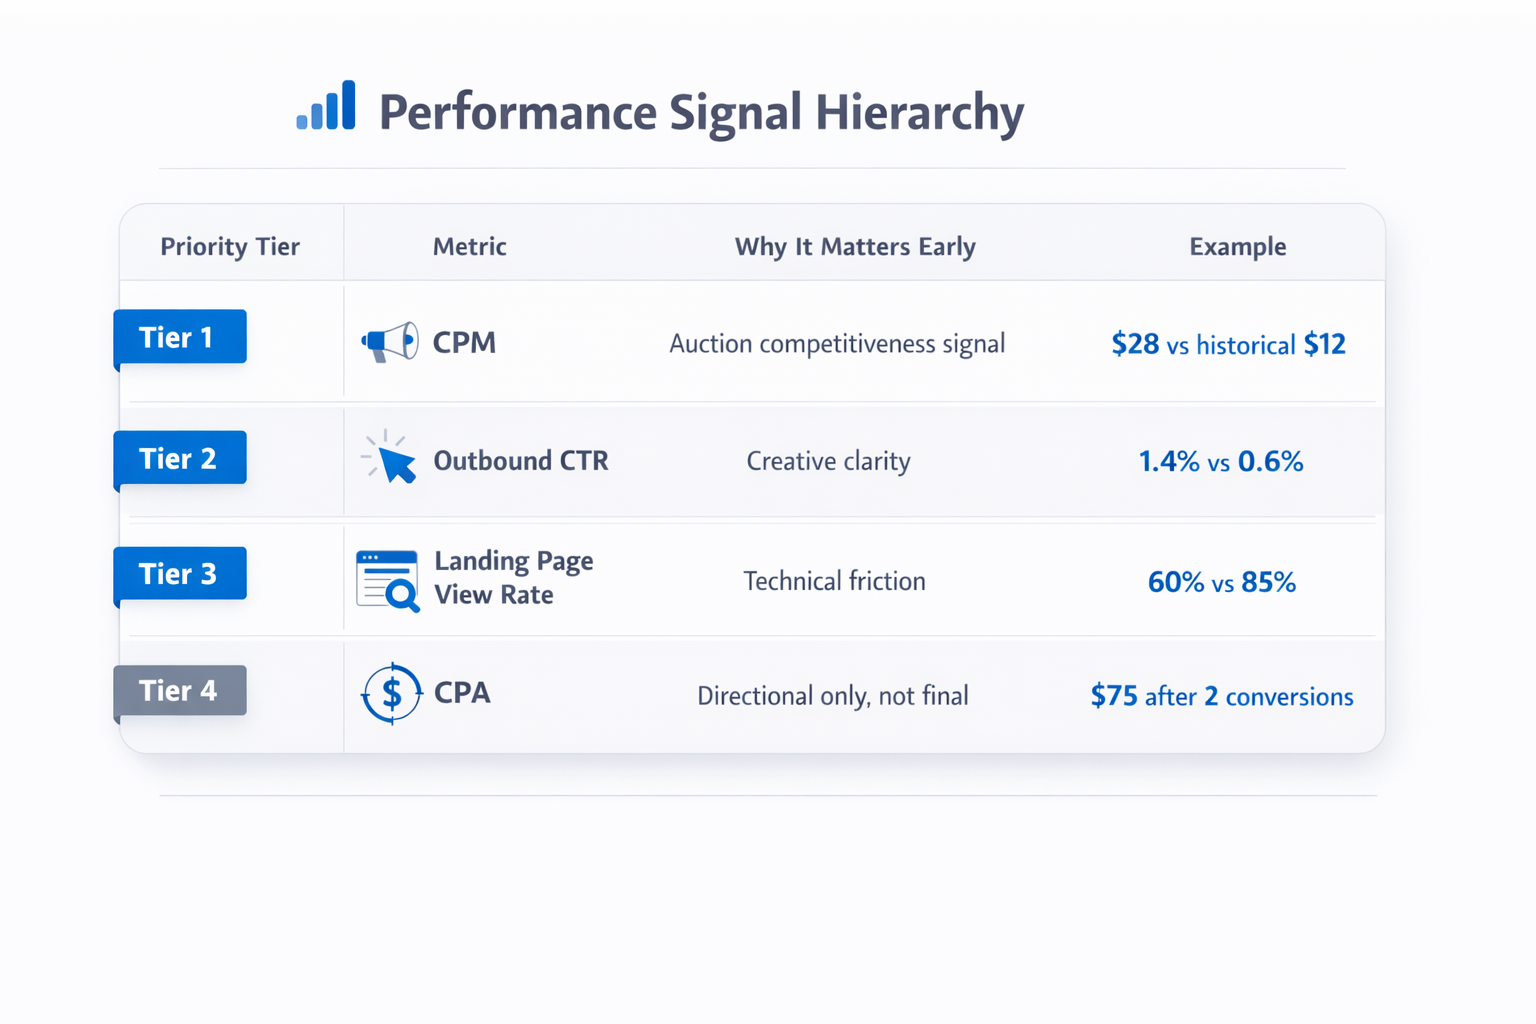
Meta’s delivery system needs initial data to optimize distribution. The first impressions influence who sees your ads next. Early performance shapes the learning phase trajectory.
You are not judging final profitability in 72 hours. You are judging directional strength. This window is about signal validation, not long-term ROI.
If you want a deeper breakdown of early performance signals, review what to watch in the first 24 hours of a Facebook campaign launch.
During this period, focus on:
-
Signal density; for example, generating 15 purchases in two days gives the algorithm usable feedback, while 2 purchases do not.
-
Cost structure; if your historical CPM is $12 and the new campaign opens at $28, something structural is wrong.
-
Behavioral response; a 1.5 percent outbound CTR on cold traffic signals interest, while 0.4 percent signals indifference.
If the early signals are weak, scaling only amplifies inefficiency.
Hour 0–24: Validate Delivery Mechanics
The first 24 hours are about technical validation, not performance judgment. Many campaigns fail because of structural mistakes. Do not optimize creative before confirming clean delivery.
Check Distribution Stability
Before reading conversion metrics, review delivery behavior inside Ads Manager.
Look at:
-
Impressions and reach; if an ad set spends only 20 percent of its budget, audience size or bid constraints may limit delivery.
-
CPM; for example, a sudden jump from $10 to $25 often points to audience overlap or narrow placements.
-
Frequency; if frequency hits 2.0 on day one with a 50,000-person audience, budget is too aggressive.
If CPM is unusually high, study the auction mechanics more closely. For a deeper explanation, read what influences CPM on Facebook Ads and how to keep it low.
Evaluate Click Behavior, Not Conversions
Conversions are unreliable in the first day because volume is low. Instead, analyze pre-conversion intent. Early click quality predicts downstream performance.
Focus on:
-
Link click-through rate; if your cold traffic average is 1 percent and the new ad sits at 0.6 percent, the hook likely misses the pain point.
-
Outbound CTR; for example, 1.2 percent outbound CTR with only 1.5 percent link CTR suggests strong intentional clicks.
-
Cost per click; if similar campaigns deliver $0.80 CPC and the new one sits at $1.70, creative alignment is off.
If CTR is low, you may need to revisit your hook structure and positioning. If CTR is strong but conversions are zero, inspect landing friction.
Confirm Event Tracking Integrity
Broken tracking ruins early decisions. Verify event firing inside Events Manager before making changes.
Check:
-
Pixel or Conversion API status; confirm purchase or lead events appear within minutes, not hours.
-
Event prioritization; ensure your primary event, such as Purchase or Lead, is ranked correctly for optimization.
-
Deduplication; compare browser and server events to confirm one purchase equals one recorded event.
For a complete technical walkthrough, see the complete guide to Facebook Pixel setup and optimization.
Never scale a campaign with unreliable tracking.
Hour 24–48: Assess Signal Quality
After the first day, patterns begin to form. Now you can evaluate behavioral consistency rather than isolated numbers.
Analyze Audience Response Patterns
Segment results by age, gender, and placement to identify imbalance.
Ask:
-
Are Instagram Stories generating cheap clicks at $0.50 but zero purchases, while Facebook Feed converts at $18 CPA?
-
Is the 18–24 segment spending 40 percent of the budget with no conversions, while 35–44 converts profitably?
-
Does one ad receive 80 percent of impressions while others remain stuck in learning?
Uneven budget allocation often hides stronger secondary performers.
These patterns reveal optimization bias. Meta shifts budget toward early responders, even if they are low intent.
Review Funnel Friction Indicators
At this stage, examine micro-conversions to detect misalignment.
Key indicators include:
-
Landing page view rate; if 1,000 clicks generate only 600 page views, load speed or tracking issues exist.
-
Time on page; an average of 8 seconds often signals mismatch between ad promise and page headline.
-
Add-to-cart or form opens; for example, 30 add-to-carts from 500 visitors indicates buying intent despite low purchases.
If click metrics look healthy but engagement is shallow, you are facing a post-click issue. Review why your Facebook ads aren’t converting and how to fix it for deeper diagnostics.
Identify Creative Fatigue Signals
Fatigue can appear quickly in narrow audiences.
Watch for:
-
Rising CPM from $11 to $18 within 48 hours without scaling budget.
-
Declining CTR from 1.4 percent to 0.9 percent after stable early traction.
-
Frequency exceeding 2.5 while audience size remains under 100,000.
Rapid frequency growth is an early warning sign of saturation.
For a structured approach, read how to avoid ad fatigue and keep optimal ad performance.
Hour 48–72: Make Structured Decisions
By the third day, you should have sufficient directional data. Decisions must follow predefined thresholds, not emotions.
Define Clear Decision Thresholds
Create numeric guardrails before launch.
Examples:
-
Kill if cost per lead exceeds $40 after 3,000 impressions when your target is $25.
-
Scale if cost per purchase stays within 10 percent of your $60 target and CTR beats account average.
-
Iterate creative if CTR is below 0.8 percent but conversion rate exceeds 4 percent.
Thresholds prevent constant micro-adjustments that reset learning.
Separate Creative Failure from Offer Failure
Many advertisers change targeting first. Most issues originate in creative or offer framing.
Use this diagnostic logic:
-
High CTR at 1.8 percent and low 1 percent conversion rate; landing page or pricing problem.
-
Low CTR at 0.5 percent with stable CPM; weak hook or unclear benefit statement.
-
High CPM at $30 with 0.7 percent CTR; audience too competitive or poorly matched.
Diagnosing correctly saves budget and preserves learning stability.
Evaluate Learning Phase Progress
Check whether ad sets move toward stable delivery.
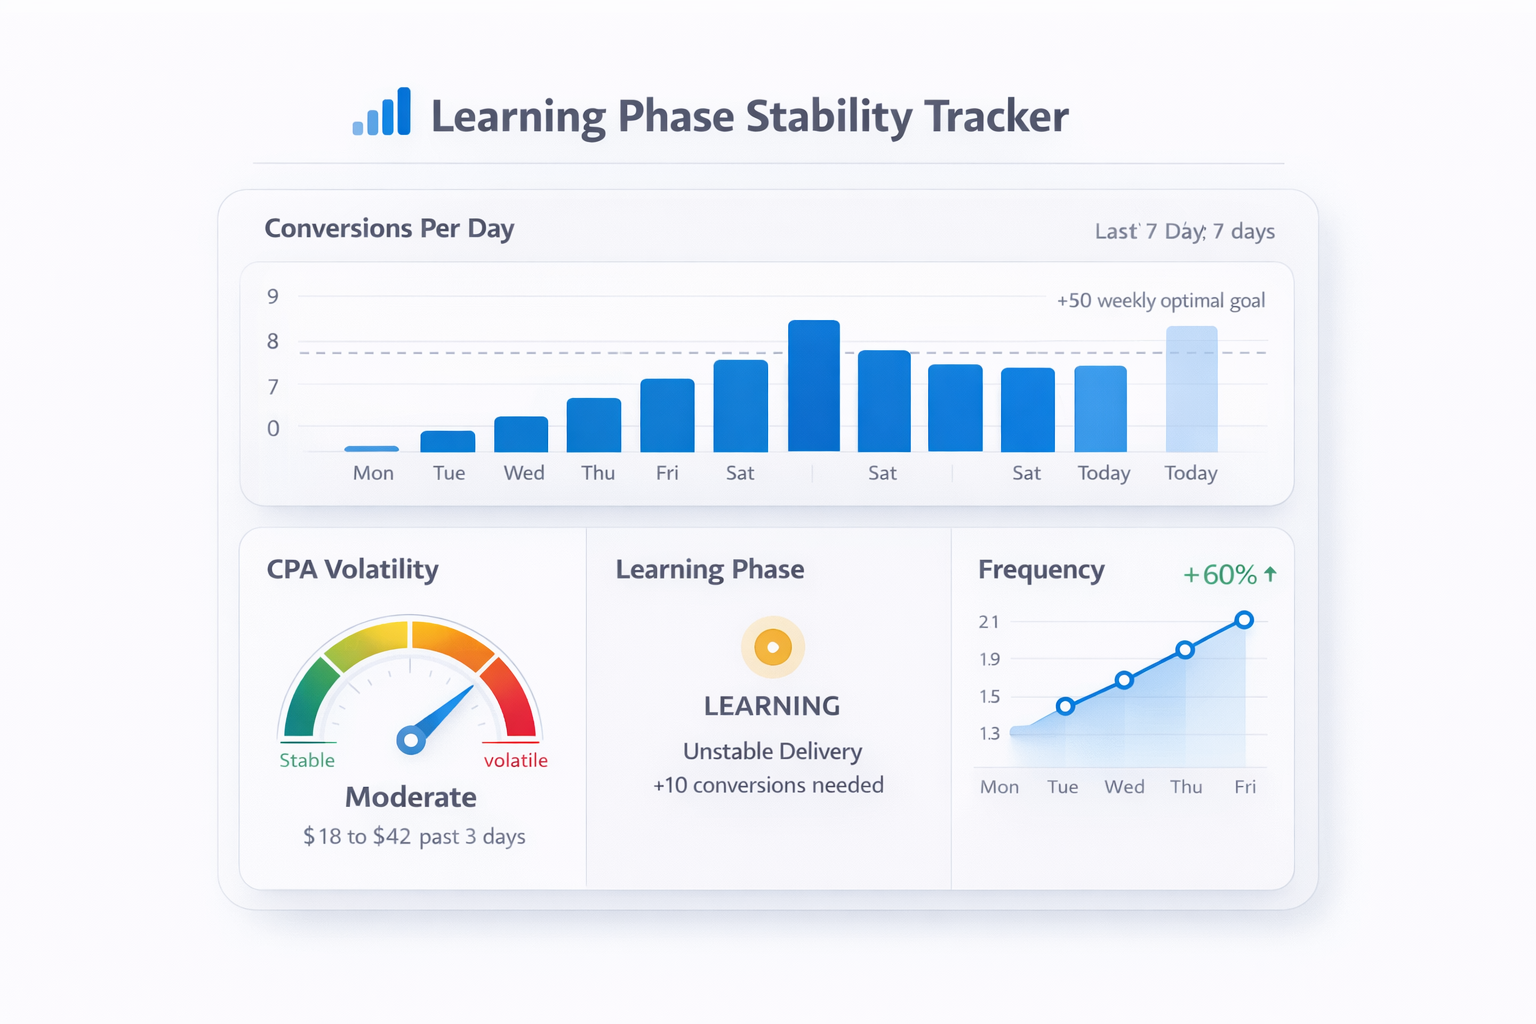
Look at:
-
Conversion volume; aim for roughly 50 optimization events per week, such as 7 purchases per day.
-
Cost volatility; if CPA swings between $20 and $90 daily, learning remains unstable.
-
Delivery consistency; sudden spend spikes distort performance interpretation.
If learning remains unstable after 72 hours, review how to use the Facebook Ads learning phase to your advantage.
Advanced Considerations Most Advertisers Ignore
Surface metrics do not tell the full story. Experienced operators examine structural dynamics.
Budget Allocation Bias
Meta directs spend toward early winners.
For example, if one video consumes 85 percent of spend in two days, manually equalize budgets to test alternatives fairly.
Early dominance does not guarantee long-term profitability.
Time-of-Day Effects
Short windows can hide dayparting behavior.
If a campaign launches at 11 PM, early data may reflect low-intent browsing. Review hourly breakdowns before making final decisions.
Creative Angle Saturation
Audience familiarity reduces response even when design remains strong.
Track:
-
Comment tone; repeated comments like “I’ve seen this already” signal fatigue.
-
Save rate; fewer saves often predict declining conversion intent.
-
Quality ranking; a drop from Above Average to Below Average usually precedes cost increases.
Qualitative feedback often predicts quantitative decline.
When to Extend Beyond 72 Hours
Some funnels need more time to produce measurable conversions.
Extend evaluation if:
-
Click-through rate exceeds historical averages but purchases lag.
-
Attribution window spans seven days and buying decisions are complex.
-
Leads require manual sales follow-up before revenue appears.
In these cases, analyze pipeline metrics such as qualified lead rate instead of immediate revenue.
Final Decision Matrix
At the 72-hour mark, each campaign falls into one of three categories.
-
Scale; cost per result meets target and engagement metrics remain stable.
-
Iterate; strong CTR but weak conversion rate suggests offer or page refinement.
-
Kill; low engagement and rising costs show no positive trajectory.
Document every decision and the metrics behind it. Over time, these notes form your internal benchmark system and improve future launches.