
Modern marketing teams are surrounded by dashboards, reports, and real‑time metrics. Yet access to data does not automatically lead to better decisions. When data is misunderstood, taken out of context, or oversimplified, it can produce conclusions that feel confident but are fundamentally wrong. The cost of poor data interpretation is rarely immediate or obvious, but over time it compounds into wasted spend, missed opportunities, and strategic drift.
When More Data Leads to Worse Decisions
As data volume increases, so does the risk of misinterpretation. Teams often focus on surface‑level indicators—such as short‑term spikes in click‑through rate or conversion volume—without understanding why those changes occurred. According to industry research, organizations that rely on poorly interpreted analytics are significantly more likely to make ineffective strategic decisions compared to those with strong data literacy.
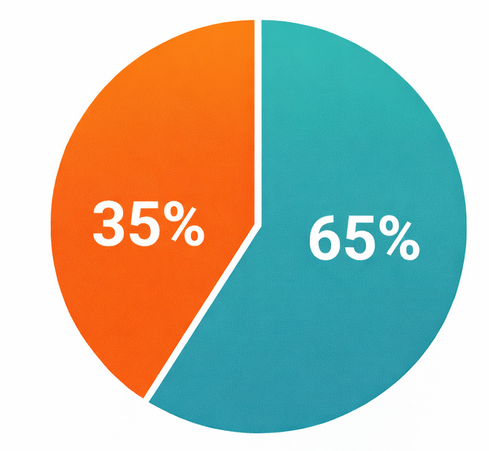
Over one-third of data leaders identify poor data literacy as a key roadblock to analytics success
One common issue is confusing correlation with causation. A sudden lift in performance may be attributed to a campaign change, while in reality it could be driven by seasonality, audience overlap, or external market shifts. Acting on these false signals often leads to scaling tactics that are not truly responsible for the results.
The Financial Impact of Misread Metrics
The financial consequences of poor data interpretation are substantial. Studies show that businesses lose an estimated 15–25% of marketing budgets due to inefficient allocation driven by incorrect performance analysis. This waste often comes from:
-
Scaling channels that appear profitable but are influenced by attribution bias
-
Pausing campaigns that look weak in isolation but contribute strongly to assisted conversions
-
Over‑investing in high‑frequency exposure that inflates impressions while reducing incremental lift
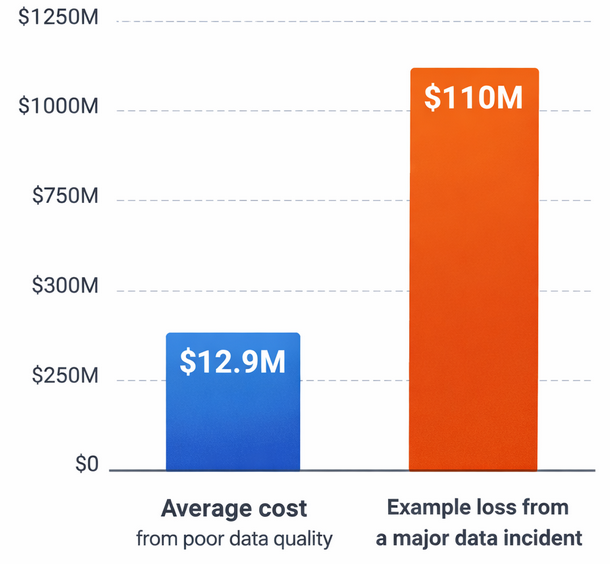
Annual financial losses from poor data quality show how misinterpretation drains budgets across organizations
In digital advertising, misinterpreting performance trends can also inflate customer acquisition costs. For example, failing to account for diminishing returns at higher audience frequency frequently results in higher spend for lower marginal gains.
How Poor Interpretation Distorts Optimization
Optimization depends on feedback loops. When the data feeding those loops is misunderstood, optimization efforts push performance in the wrong direction. A typical example is optimizing purely toward short‑term conversion metrics without evaluating audience quality or long‑term value.
Research indicates that nearly 60% of marketing teams admit to optimizing campaigns based on incomplete or misleading data views. Over time, this leads to creative fatigue, audience saturation, and unstable performance patterns that are difficult to diagnose after the fact.
Another distortion comes from relying on averages. Aggregate metrics often hide meaningful variations between audience segments, placements, or time windows. Decisions made on blended performance data can overlook pockets of strong efficiency or mask underperforming segments that require intervention.
The Hidden Cost: Organizational Confidence
Beyond budget waste, poor data interpretation erodes internal confidence. When decisions repeatedly fail to deliver expected outcomes, teams begin to distrust analytics altogether. This can push organizations back toward intuition‑driven decision‑making, further weakening performance discipline.
In surveys of data‑driven organizations, teams with low confidence in their analytics are far less likely to act decisively on insights, leading to slower execution and reduced competitive advantage.
Improving Data Interpretation Discipline
Avoiding these costs does not require more tools—it requires better analytical habits. Effective teams invest in:
-
Clear definitions of success metrics aligned with business outcomes
-
Consistent comparison windows to avoid false trend signals
-
Segmented analysis instead of relying on blended averages
-
Cross‑checking results against historical baselines and external benchmarks
Organizations that adopt structured interpretation frameworks are shown to improve marketing efficiency by double‑digit percentages, primarily by reducing waste rather than increasing spend.
Conclusion
Data itself is neutral. The value—or damage—comes from how it is interpreted. Poor data interpretation quietly taxes every part of a growth strategy, from budget efficiency to team confidence. By improving analytical discipline and resisting oversimplified conclusions, teams can turn data from a source of confusion into a genuine competitive advantage.