Ad fatigue occurs when audiences are overexposed to the same creative, messaging, or offer, resulting in declining engagement and conversion rates. According to industry benchmarks, click-through rates (CTR) can drop by 15–25% within the first two weeks of high-frequency exposure, while cost per acquisition (CPA) may increase by 20–30% once saturation begins.
Traditional reporting identifies fatigue after performance metrics decline. Artificial intelligence shifts this paradigm by detecting subtle behavioral and delivery pattern changes before financial impact becomes visible.
What Is Ad Fatigue From a Data Perspective?
From a performance analytics standpoint, ad fatigue is a multi-variable degradation pattern characterized by:
-
Rising frequency with diminishing incremental reach
-
Declining CTR and engagement rate
-
Increasing CPA and cost per click (CPC)
-
Reduced post-click engagement (time on page, scroll depth, conversions)
-
Creative-level performance divergence
AI models analyze these variables simultaneously rather than in isolation.
Key Statistics That Highlight the Problem
-
Campaigns with ad frequency above 4 impressions per user often see CTR decline by 30% or more.
-
61% of marketers report creative fatigue as a top factor limiting paid media scalability.
-
Replacing fatigued creatives early can improve conversion rates by 10–18%.
-
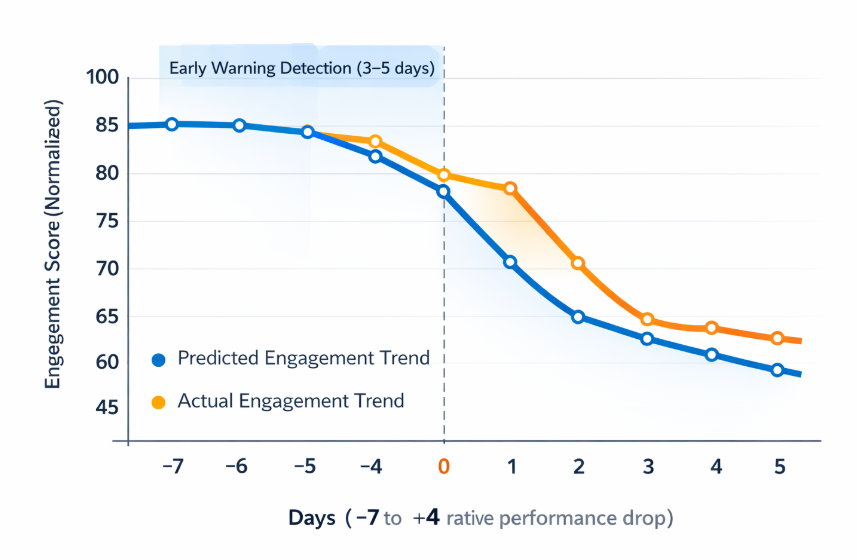
Predictive performance models can detect statistically significant engagement decay 3–5 days before visible KPI deterioration.
Trend chart showing how click-through rate (CTR) declines as ad frequency increases, with a marked drop once frequency exceeds 4 impressions per user
These figures demonstrate that early detection has measurable financial implications.
How AI Detects Ad Fatigue Early
1. Pattern Recognition Across Time Series Data
AI systems monitor performance trends using time-series modeling. Instead of comparing daily CTR snapshots, machine learning models analyze slope acceleration, volatility changes, and micro-deviations from expected baselines.
For example, if engagement declines at a rate 1.5x faster than historical averages for similar audiences, the system flags early fatigue risk.
2. Predictive Deviation Modeling
AI establishes a predicted performance curve based on historical data, audience composition, and delivery parameters. When real-time performance deviates beyond confidence intervals, alerts are triggered.
This allows teams to act before CPC inflation becomes significant.
3. Creative-Level Clustering
Machine learning groups creatives based on format, message angle, emotional tone, and visual structure. When similar clusters simultaneously show decay patterns, the system identifies systemic fatigue rather than isolated underperformance.
4. Audience Saturation Analysis
AI evaluates overlap ratios and impression distribution across segments. High repetition within narrow segments signals future performance erosion.
When overlap exceeds threshold tolerances, fatigue probability increases.
5. Engagement Quality Signals
Beyond CTR, AI monitors secondary indicators such as:
-
Scroll depth reduction
-
Decreasing session duration
-
Conversion path drop-offs
-
Rising bounce rates
Subtle declines in these metrics often precede visible CTR drops.
Operational Framework: Acting Before Performance Drops
Step 1: Establish Predictive Baselines
Use historical campaign data to define expected lifecycle curves for each creative format and audience type.
Step 2: Define Fatigue Thresholds
Set quantitative triggers such as:
-
10% engagement decline within 72 hours
-
15% CPA inflation relative to model forecast
-
Frequency approaching 3.5–4.0 with declining incremental conversions
Step 3: Automate Alerts
Implement automated reporting workflows that notify media buyers when deviation thresholds are crossed.
Step 4: Prepare Creative Rotation in Advance
AI detection is only effective if replacement creatives are ready. Maintain a structured rotation pipeline:
-
Core evergreen creatives
-
Variant testing batch
-
Experimental messaging set
Step 5: Run Controlled Refresh Tests
Instead of pausing fatigued ads abruptly, test refreshed variants against the original to validate recovery.
Financial Impact of Early Detection
Assume a campaign spending $50,000 per month. If ad fatigue increases CPA by 25% for two weeks before detection, the wasted budget may exceed $6,000–$8,000. Predictive detection that shortens fatigue exposure by even five days can materially improve return on ad spend.
At scale, across multiple campaigns, this translates into substantial annual savings.
Common Mistakes in Managing Ad Fatigue
-
Reacting only after CTR drops significantly
-
Ignoring frequency as a leading indicator
-
Refreshing visuals without changing messaging
-
Rotating creatives too late in the lifecycle
-
Failing to segment audiences properly
AI-driven systems mitigate these risks by analyzing multidimensional performance signals continuously.
Integrating AI Into Your Paid Media Workflow
To operationalize AI-based fatigue detection:
-
Centralize performance data across platforms
-
Standardize KPI definitions
-
Use predictive analytics instead of static dashboards
-
Align creative production cycles with data insights
-
Continuously retrain models with fresh campaign data
The goal is not reactive optimization but predictive performance control.
Conclusion
Ad fatigue is not a sudden failure event. It is a measurable, predictable performance decay pattern. AI enables marketers to identify early-warning signals, model expected decline, and intervene before key metrics suffer.
Organizations that implement predictive fatigue detection typically achieve:
-
More stable CTR trends
-
Lower CPA volatility
-
Higher creative testing velocity
-
Improved budget efficiency
The competitive advantage lies not in responding faster to drops, but in preventing them altogether.